29
/
en
AIzaSyAYiBZKx7MnpbEhh9jyipgxe19OcubqV5w
April 1, 2024
219691
Papua New Guinea
PNG
true
2
1
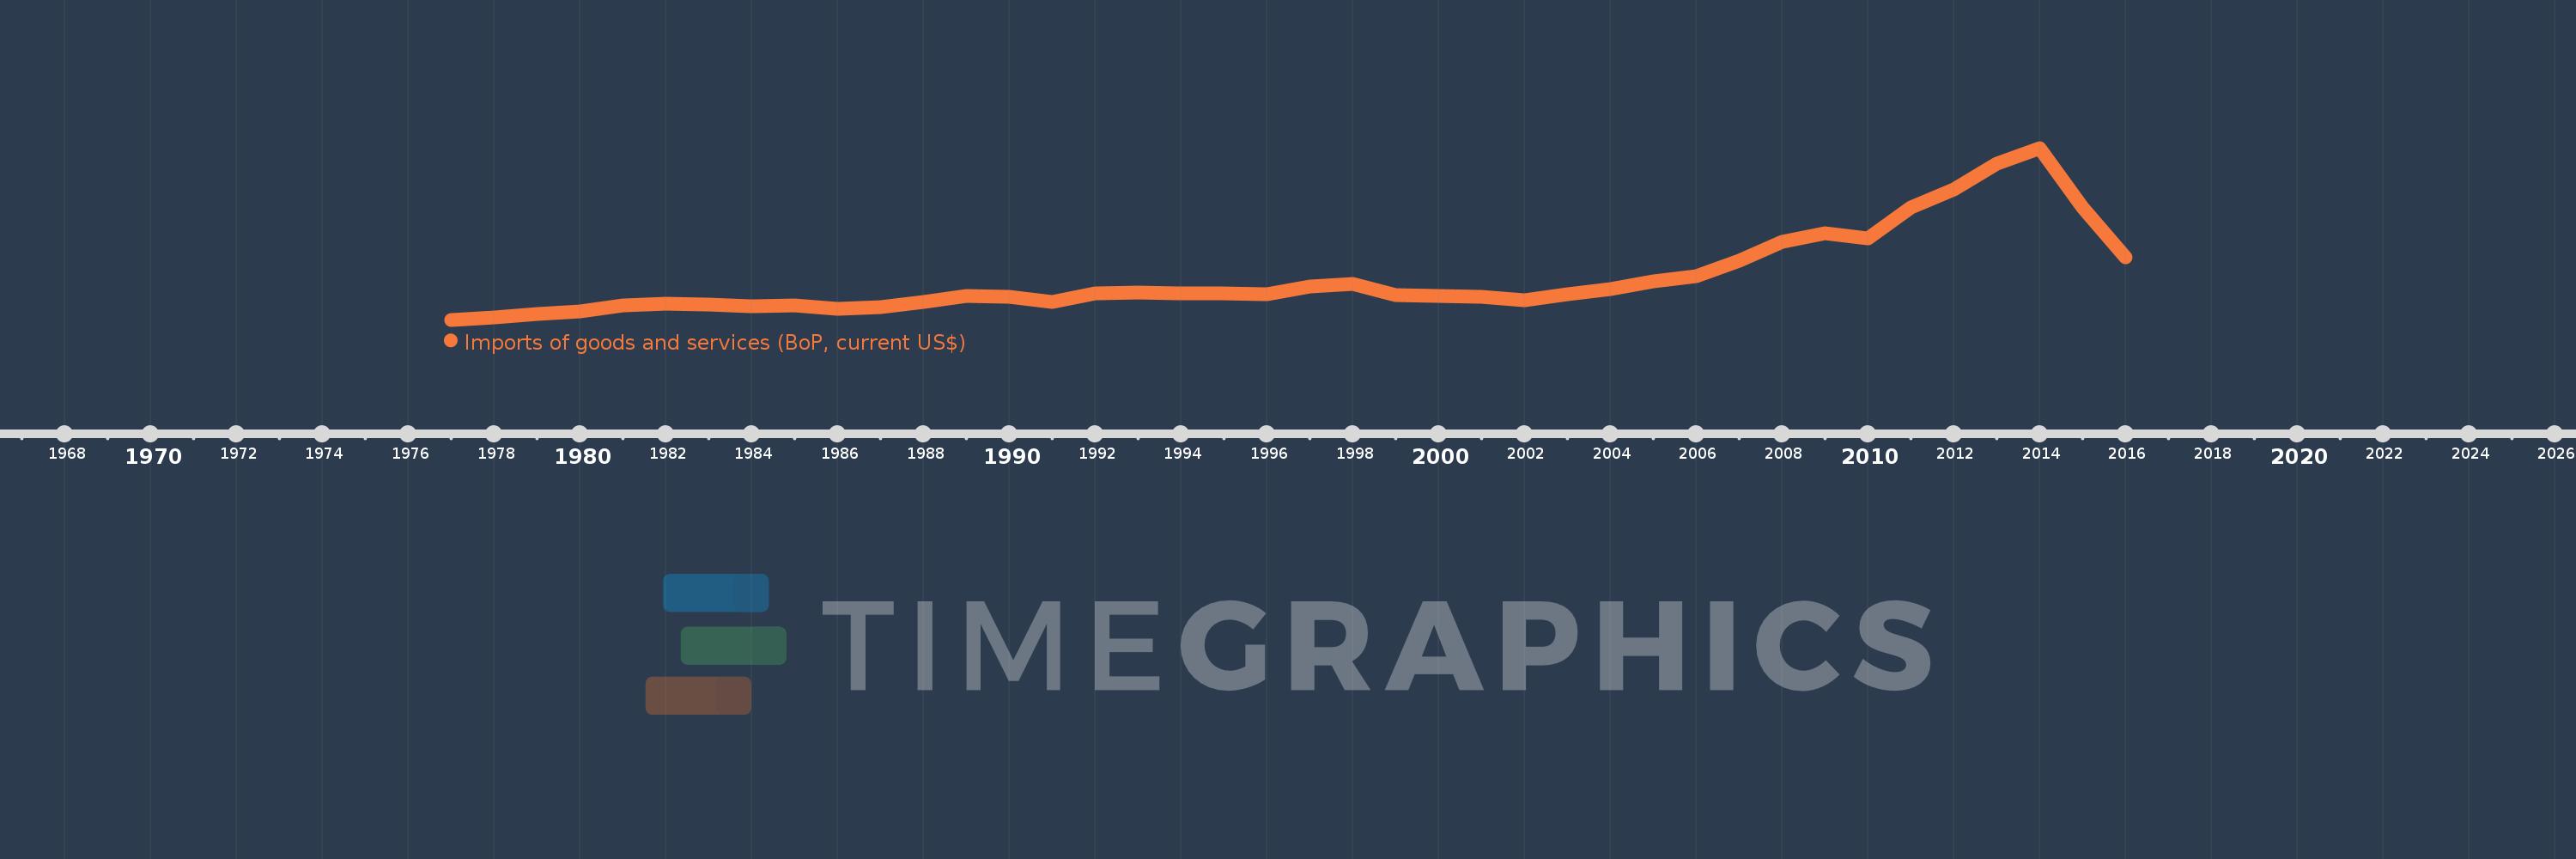
Imports of goods and services (BoP, current US$)
2016,2015,2014,2013,2012,2011,2010,2009,2008,2007,2006,2005,2004,2003,2002,2001,2000,1999,1998,1997,1996,1995,1994,1993,1992,1991,1990,1989,1988,1987,1986,1985,1984,1983,1982,1981,1980,1979,1978,1977
This statistics in other country:
AfghanistanAlbaniaAlgeriaAngolaAntigua and BarbudaArab WorldArgentinaArmeniaArubaAustraliaAustriaAzerbaijanBahamas, TheBahrainBangladeshBarbadosBelarusBelgiumBelizeBeninBermudaBhutanBoliviaBosnia and HerzegovinaBotswanaBrazilBrunei DarussalamBulgariaBurkina FasoBurundiCabo VerdeCambodiaCameroonCanadaCaribbean small statesCentral African RepublicCentral Europe and the BalticsChadChileChinaColombiaComorosCongo, Dem. Rep.Congo, Rep.Costa RicaCote d'IvoireCroatiaCuracaoCyprusCzech RepublicDenmarkDjiboutiDominicaDominican RepublicEarly-demographic dividendEast Asia & PacificEast Asia & Pacific (excluding high income)East Asia & Pacific (IDA & IBRD countries)EcuadorEgypt, Arab Rep.El SalvadorEquatorial GuineaEritreaEstoniaEthiopiaEuro areaEurope & Central AsiaEurope & Central Asia (excluding high income)Europe & Central Asia (IDA & IBRD countries)European UnionFaroe IslandsFijiFinlandFragile and conflict affected situationsFranceFrench PolynesiaGabonGambia, TheGeorgiaGermanyGhanaGreeceGrenadaGuatemalaGuineaGuinea-BissauGuyanaHaitiHeavily indebted poor countries (HIPC)High incomeHondurasHong Kong SAR, ChinaHungaryIBRD onlyIcelandIDA & IBRD totalIDA blendIDA onlyIDA totalIndiaIndonesiaIran, Islamic Rep.IraqIrelandIsraelItalyJamaicaJapanJordanKazakhstanKenyaKiribatiKorea, Rep.KosovoKuwaitKyrgyz RepublicLao PDRLate-demographic dividendLatin America & Caribbean Latin America & Caribbean (excluding high income)Latin America & the Caribbean (IDA & IBRD countries)LatviaLeast developed countries: UN classificationLebanonLesothoLiberiaLibyaLithuaniaLow & middle incomeLow incomeLower middle incomeLuxembourgMacao SAR, ChinaMacedonia, FYRMadagascarMalawiMalaysiaMaldivesMaliMaltaMarshall IslandsMauritaniaMauritiusMexicoMicronesia, Fed. Sts.Middle East & North Africa (excluding high income)Middle East & North Africa (IDA & IBRD countries)Middle incomeMoldovaMongoliaMontenegroMoroccoMozambiqueMyanmarNamibiaNepalNetherlandsNew CaledoniaNicaraguaNigerNigeriaNorth AmericaNorwayOECD membersOmanOther small statesPacific island small statesPakistanPalauPanamaPapua New GuineaParaguayPeruPhilippinesPolandPortugalPost-demographic dividendPre-demographic dividendQatarRomaniaRussian FederationRwandaSamoaSao Tome and PrincipeSaudi ArabiaSenegalSerbiaSeychellesSierra LeoneSingaporeSint Maarten (Dutch part)Slovak RepublicSloveniaSmall statesSolomon IslandsSouth AfricaSouth AsiaSouth Asia (IDA & IBRD)South SudanSpainSri LankaSt. Kitts and NevisSt. LuciaSt. Vincent and the GrenadinesSub-Saharan Africa Sub-Saharan Africa (excluding high income)Sub-Saharan Africa (IDA & IBRD countries)SudanSurinameSwazilandSwedenSwitzerlandSyrian Arab RepublicTajikistanTanzaniaThailandTimor-LesteTogoTongaTrinidad and TobagoTunisiaTurkeyTuvaluUgandaUkraineUnited KingdomUnited StatesUpper middle incomeUruguayVanuatuVenezuela, RBVietnamWest Bank and GazaWorldYemen, Rep.ZambiaZimbabwe Timeline:
This timeline shows a graph from 1977 to 2016 of Papua New Guinea. No data until 1976. Number of actual observations by date: 40.
Source name:
World Development Indicators
Source organization:
International Monetary Fund, Balance of Payments Statistics Yearbook and data files.
Categories, topics:
Economy & Growth, Trade
Last updated:
apr 23, 2017
Indicators value changes by year
Minimum:
609.842 mln
jan 1, 1977
Maximum:
9.306 bln
jan 1, 2014
At the date of observation
Value
Absolute change
Change from previous value
jan 1, 1977
609.842 mln
+609.842 mln
0.0%
jan 1, 1978
743.591 mln
+133.748 mln
21.93%
jan 1, 1979
905.512 mln
+161.921 mln
21.78%
jan 1, 1980
1.021 bln
+115.649 mln
12.77%
jan 1, 1981
1.322 bln
+300.943 mln
29.47%
jan 1, 1982
1.438 bln
+116.368 mln
8.8%
jan 1, 1983
1.365 bln
-73.1 mln
-5.08%
jan 1, 1984
1.308 bln
-57.246 mln
-4.19%
jan 1, 1985
1.319 bln
+10.74 mln
0.82%
jan 1, 1986
1.163 bln
-155.596 mln
-11.8%
jan 1, 1987
1.231 bln
+68.22 mln
5.86%
jan 1, 1988
1.507 bln
+275.673 mln
22.39%
jan 1, 1989
1.82 bln
+312.38 mln
20.73%
jan 1, 1990
1.75 bln
-69.447 mln
-3.82%
jan 1, 1991
1.509 bln
-241.233 mln
-13.78%
jan 1, 1992
1.947 bln
+438.318 mln
29.05%
jan 1, 1993
2.009 bln
+61.536 mln
3.16%
jan 1, 1994
1.939 bln
-69.474 mln
-3.46%
jan 1, 1995
1.933 bln
-6.31 mln
-0.33%
jan 1, 1996
1.905 bln
-28.386 mln
-1.47%
jan 1, 1997
2.292 bln
+387.244 mln
20.33%
jan 1, 1998
2.407 bln
+115.055 mln
5.02%
jan 1, 1999
1.872 bln
-534.733 mln
-22.22%
jan 1, 2000
1.799 bln
-72.829 mln
-3.89%
jan 1, 2001
1.771 bln
-28.212 mln
-1.57%
jan 1, 2002
1.594 bln
-176.679 mln
-9.98%
jan 1, 2003
1.912 bln
+317.487 mln
19.91%
jan 1, 2004
2.154 bln
+242.574 mln
12.69%
jan 1, 2005
2.565 bln
+410.23 mln
19.04%
jan 1, 2006
2.803 bln
+238.487 mln
9.3%
jan 1, 2007
3.586 bln
+783.105 mln
27.94%
jan 1, 2008
4.575 bln
+988.366 mln
27.56%
jan 1, 2009
4.984 bln
+408.934 mln
8.94%
jan 1, 2010
4.711 bln
-272.933 mln
-5.48%
jan 1, 2011
6.286 bln
+1.575 bln
33.43%
jan 1, 2012
7.205 bln
+919.804 mln
14.63%
jan 1, 2013
8.499 bln
+1.294 bln
17.96%
jan 1, 2014
9.306 bln
+806.714 mln
9.49%
jan 1, 2015
6.294 bln
-3.012 bln
-32.37%
jan 1, 2016
3.753 bln
-2.541 bln
-40.37%
Ranking of countries by current statistics by years


Comments: