29
/
en
AIzaSyAYiBZKx7MnpbEhh9jyipgxe19OcubqV5w
April 1, 2024
123619
Ecuador
ECU
true
2
1
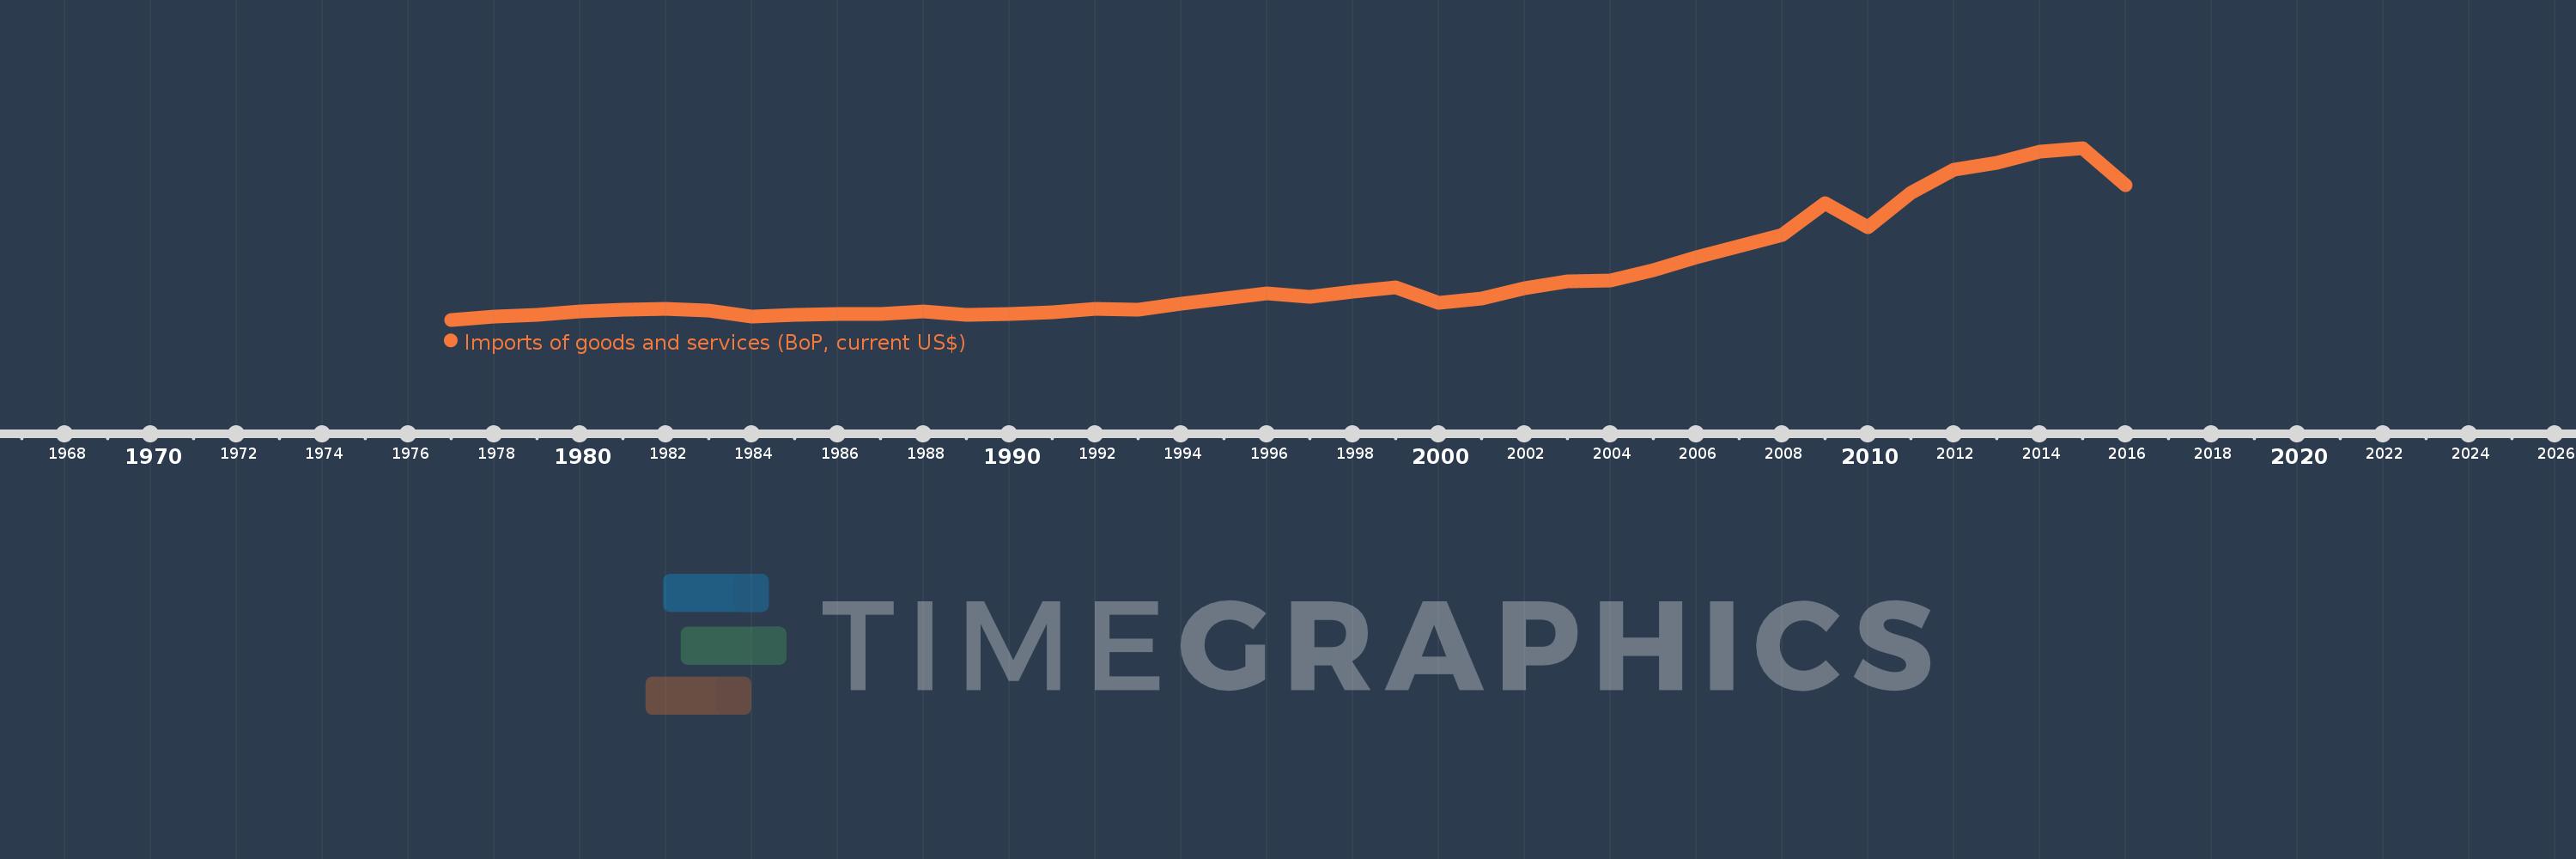
Imports of goods and services (BoP, current US$)
2016,2015,2014,2013,2012,2011,2010,2009,2008,2007,2006,2005,2004,2003,2002,2001,2000,1999,1998,1997,1996,1995,1994,1993,1992,1991,1990,1989,1988,1987,1986,1985,1984,1983,1982,1981,1980,1979,1978,1977
This statistics in other country:
AfghanistanAlbaniaAlgeriaAngolaAntigua and BarbudaArab WorldArgentinaArmeniaArubaAustraliaAustriaAzerbaijanBahamas, TheBahrainBangladeshBarbadosBelarusBelgiumBelizeBeninBermudaBhutanBoliviaBosnia and HerzegovinaBotswanaBrazilBrunei DarussalamBulgariaBurkina FasoBurundiCabo VerdeCambodiaCameroonCanadaCaribbean small statesCentral African RepublicCentral Europe and the BalticsChadChileChinaColombiaComorosCongo, Dem. Rep.Congo, Rep.Costa RicaCote d'IvoireCroatiaCuracaoCyprusCzech RepublicDenmarkDjiboutiDominicaDominican RepublicEarly-demographic dividendEast Asia & PacificEast Asia & Pacific (excluding high income)East Asia & Pacific (IDA & IBRD countries)EcuadorEgypt, Arab Rep.El SalvadorEquatorial GuineaEritreaEstoniaEthiopiaEuro areaEurope & Central AsiaEurope & Central Asia (excluding high income)Europe & Central Asia (IDA & IBRD countries)European UnionFaroe IslandsFijiFinlandFragile and conflict affected situationsFranceFrench PolynesiaGabonGambia, TheGeorgiaGermanyGhanaGreeceGrenadaGuatemalaGuineaGuinea-BissauGuyanaHaitiHeavily indebted poor countries (HIPC)High incomeHondurasHong Kong SAR, ChinaHungaryIBRD onlyIcelandIDA & IBRD totalIDA blendIDA onlyIDA totalIndiaIndonesiaIran, Islamic Rep.IraqIrelandIsraelItalyJamaicaJapanJordanKazakhstanKenyaKiribatiKorea, Rep.KosovoKuwaitKyrgyz RepublicLao PDRLate-demographic dividendLatin America & Caribbean Latin America & Caribbean (excluding high income)Latin America & the Caribbean (IDA & IBRD countries)LatviaLeast developed countries: UN classificationLebanonLesothoLiberiaLibyaLithuaniaLow & middle incomeLow incomeLower middle incomeLuxembourgMacao SAR, ChinaMacedonia, FYRMadagascarMalawiMalaysiaMaldivesMaliMaltaMarshall IslandsMauritaniaMauritiusMexicoMicronesia, Fed. Sts.Middle East & North Africa (excluding high income)Middle East & North Africa (IDA & IBRD countries)Middle incomeMoldovaMongoliaMontenegroMoroccoMozambiqueMyanmarNamibiaNepalNetherlandsNew CaledoniaNicaraguaNigerNigeriaNorth AmericaNorwayOECD membersOmanOther small statesPacific island small statesPakistanPalauPanamaPapua New GuineaParaguayPeruPhilippinesPolandPortugalPost-demographic dividendPre-demographic dividendQatarRomaniaRussian FederationRwandaSamoaSao Tome and PrincipeSaudi ArabiaSenegalSerbiaSeychellesSierra LeoneSingaporeSint Maarten (Dutch part)Slovak RepublicSloveniaSmall statesSolomon IslandsSouth AfricaSouth AsiaSouth Asia (IDA & IBRD)South SudanSpainSri LankaSt. Kitts and NevisSt. LuciaSt. Vincent and the GrenadinesSub-Saharan Africa Sub-Saharan Africa (excluding high income)Sub-Saharan Africa (IDA & IBRD countries)SudanSurinameSwazilandSwedenSwitzerlandSyrian Arab RepublicTajikistanTanzaniaThailandTimor-LesteTogoTongaTrinidad and TobagoTunisiaTurkeyTuvaluUgandaUkraineUnited KingdomUnited StatesUpper middle incomeUruguayVanuatuVenezuela, RBVietnamWest Bank and GazaWorldYemen, Rep.ZambiaZimbabwe Timeline:
This timeline shows a graph from 1977 to 2016 of Ecuador. No data until 1976. Number of actual observations by date: 40.
Source name:
World Development Indicators
Source organization:
International Monetary Fund, Balance of Payments Statistics Yearbook and data files.
Categories, topics:
Economy & Growth, Trade
Last updated:
apr 23, 2017
Indicators value changes by year
Minimum:
1.316 bln
jan 1, 1977
Maximum:
30.215 bln
jan 1, 2015
At the date of observation
Value
Absolute change
Change from previous value
jan 1, 1977
1.316 bln
+1.316 bln
0.0%
jan 1, 1978
1.786 bln
+469.9 mln
35.7%
jan 1, 1979
2.179 bln
+392.9 mln
22.0%
jan 1, 1980
2.666 bln
+487.3 mln
22.36%
jan 1, 1981
2.946 bln
+279.5 mln
10.48%
jan 1, 1982
3.187 bln
+241.6 mln
8.2%
jan 1, 1983
2.91 bln
-277.3 mln
-8.7%
jan 1, 1984
1.912 bln
-998.0 mln
-34.3%
jan 1, 1985
2.102 bln
+190.0 mln
9.94%
jan 1, 1986
2.247 bln
+145.0 mln
6.9%
jan 1, 1987
2.226 bln
-21.0 mln
-0.93%
jan 1, 1988
2.702 bln
+476.0 mln
21.38%
jan 1, 1989
2.189 bln
-513.0 mln
-18.99%
jan 1, 1990
2.318 bln
+129.0 mln
5.89%
jan 1, 1991
2.519 bln
+201.0 mln
8.67%
jan 1, 1992
3.108 bln
+589.0 mln
23.38%
jan 1, 1993
3.016 bln
-92.0 mln
-2.96%
jan 1, 1994
4.012 bln
+995.7 mln
33.01%
jan 1, 1995
4.894 bln
+882.73 mln
22.0%
jan 1, 1996
5.708 bln
+813.43 mln
16.62%
jan 1, 1997
5.119 bln
-589.31 mln
-10.32%
jan 1, 1998
6.099 bln
+980.05 mln
19.15%
jan 1, 1999
6.699 bln
+600.76 mln
9.85%
jan 1, 2000
4.209 bln
-2.491 bln
-37.18%
jan 1, 2001
4.927 bln
+718.115 mln
17.06%
jan 1, 2002
6.612 bln
+1.685 bln
34.2%
jan 1, 2003
7.76 bln
+1.148 bln
17.36%
jan 1, 2004
7.991 bln
+231.262 mln
2.98%
jan 1, 2005
9.651 bln
+1.661 bln
20.78%
jan 1, 2006
11.851 bln
+2.2 bln
22.79%
jan 1, 2007
13.749 bln
+1.898 bln
16.01%
jan 1, 2008
15.619 bln
+1.87 bln
13.6%
jan 1, 2009
20.925 bln
+5.306 bln
33.97%
jan 1, 2010
16.887 bln
-4.038 bln
-19.3%
jan 1, 2011
22.636 bln
+5.749 bln
34.04%
jan 1, 2012
26.535 bln
+3.899 bln
17.23%
jan 1, 2013
27.717 bln
+1.182 bln
4.46%
jan 1, 2014
29.576 bln
+1.859 bln
6.71%
jan 1, 2015
30.215 bln
+639.004 mln
2.16%
jan 1, 2016
23.933 bln
-6.282 bln
-20.79%
Ranking of countries by current statistics by years


Comments: