29
/
en
AIzaSyAYiBZKx7MnpbEhh9jyipgxe19OcubqV5w
April 1, 2024
214427
Norway
NOR
true
2
1
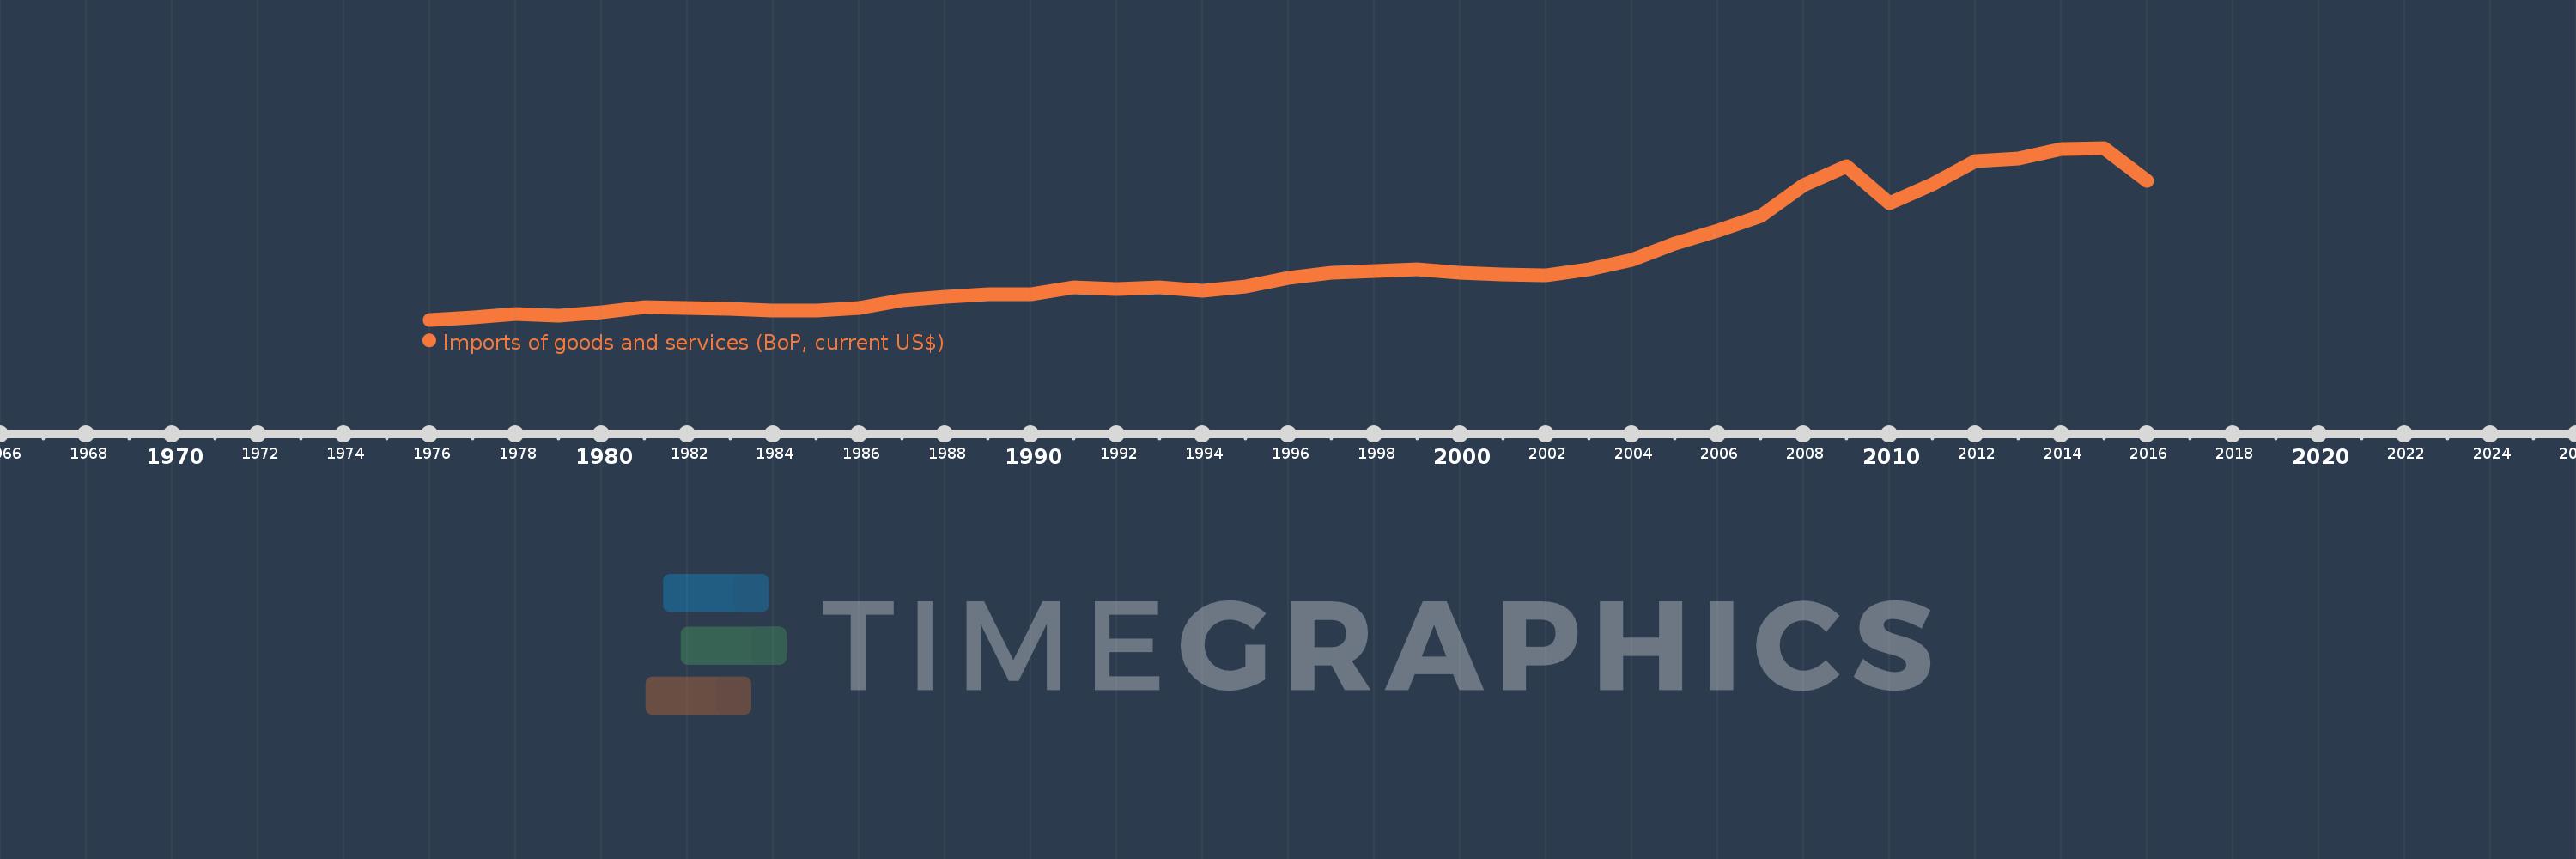
Imports of goods and services (BoP, current US$)
2016,2015,2014,2013,2012,2011,2010,2009,2008,2007,2006,2005,2004,2003,2002,2001,2000,1999,1998,1997,1996,1995,1994,1993,1992,1991,1990,1989,1988,1987,1986,1985,1984,1983,1982,1981,1980,1979,1978,1977,1976
This statistics in other country:
AfghanistanAlbaniaAlgeriaAngolaAntigua and BarbudaArab WorldArgentinaArmeniaArubaAustraliaAustriaAzerbaijanBahamas, TheBahrainBangladeshBarbadosBelarusBelgiumBelizeBeninBermudaBhutanBoliviaBosnia and HerzegovinaBotswanaBrazilBrunei DarussalamBulgariaBurkina FasoBurundiCabo VerdeCambodiaCameroonCanadaCaribbean small statesCentral African RepublicCentral Europe and the BalticsChadChileChinaColombiaComorosCongo, Dem. Rep.Congo, Rep.Costa RicaCote d'IvoireCroatiaCuracaoCyprusCzech RepublicDenmarkDjiboutiDominicaDominican RepublicEarly-demographic dividendEast Asia & PacificEast Asia & Pacific (excluding high income)East Asia & Pacific (IDA & IBRD countries)EcuadorEgypt, Arab Rep.El SalvadorEquatorial GuineaEritreaEstoniaEthiopiaEuro areaEurope & Central AsiaEurope & Central Asia (excluding high income)Europe & Central Asia (IDA & IBRD countries)European UnionFaroe IslandsFijiFinlandFragile and conflict affected situationsFranceFrench PolynesiaGabonGambia, TheGeorgiaGermanyGhanaGreeceGrenadaGuatemalaGuineaGuinea-BissauGuyanaHaitiHeavily indebted poor countries (HIPC)High incomeHondurasHong Kong SAR, ChinaHungaryIBRD onlyIcelandIDA & IBRD totalIDA blendIDA onlyIDA totalIndiaIndonesiaIran, Islamic Rep.IraqIrelandIsraelItalyJamaicaJapanJordanKazakhstanKenyaKiribatiKorea, Rep.KosovoKuwaitKyrgyz RepublicLao PDRLate-demographic dividendLatin America & Caribbean Latin America & Caribbean (excluding high income)Latin America & the Caribbean (IDA & IBRD countries)LatviaLeast developed countries: UN classificationLebanonLesothoLiberiaLibyaLithuaniaLow & middle incomeLow incomeLower middle incomeLuxembourgMacao SAR, ChinaMacedonia, FYRMadagascarMalawiMalaysiaMaldivesMaliMaltaMarshall IslandsMauritaniaMauritiusMexicoMicronesia, Fed. Sts.Middle East & North Africa (excluding high income)Middle East & North Africa (IDA & IBRD countries)Middle incomeMoldovaMongoliaMontenegroMoroccoMozambiqueMyanmarNamibiaNepalNetherlandsNew CaledoniaNicaraguaNigerNigeriaNorth AmericaNorwayOECD membersOmanOther small statesPacific island small statesPakistanPalauPanamaPapua New GuineaParaguayPeruPhilippinesPolandPortugalPost-demographic dividendPre-demographic dividendQatarRomaniaRussian FederationRwandaSamoaSao Tome and PrincipeSaudi ArabiaSenegalSerbiaSeychellesSierra LeoneSingaporeSint Maarten (Dutch part)Slovak RepublicSloveniaSmall statesSolomon IslandsSouth AfricaSouth AsiaSouth Asia (IDA & IBRD)South SudanSpainSri LankaSt. Kitts and NevisSt. LuciaSt. Vincent and the GrenadinesSub-Saharan Africa Sub-Saharan Africa (excluding high income)Sub-Saharan Africa (IDA & IBRD countries)SudanSurinameSwazilandSwedenSwitzerlandSyrian Arab RepublicTajikistanTanzaniaThailandTimor-LesteTogoTongaTrinidad and TobagoTunisiaTurkeyTuvaluUgandaUkraineUnited KingdomUnited StatesUpper middle incomeUruguayVanuatuVenezuela, RBVietnamWest Bank and GazaWorldYemen, Rep.ZambiaZimbabwe Timeline:
This timeline shows a graph from 1976 to 2016 of Norway. No data until 1975. Number of actual observations by date: 41.
Source name:
World Development Indicators
Source organization:
International Monetary Fund, Balance of Payments Statistics Yearbook and data files.
Categories, topics:
Economy & Growth, Trade
Last updated:
apr 23, 2017
Indicators value changes by year
Minimum:
13.782 bln
jan 1, 1976
Maximum:
148.771 bln
jan 1, 2015
At the date of observation
Value
Absolute change
Change from previous value
jan 1, 1976
13.782 bln
+13.782 bln
0.0%
jan 1, 1977
15.836 bln
+2.054 bln
14.9%
jan 1, 1978
18.123 bln
+2.288 bln
14.45%
jan 1, 1979
16.982 bln
-1.141 bln
-6.3%
jan 1, 1980
19.577 bln
+2.595 bln
15.28%
jan 1, 1981
23.749 bln
+4.171 bln
21.31%
jan 1, 1982
22.736 bln
-1.012 bln
-4.26%
jan 1, 1983
22.419 bln
-316.956 mln
-1.39%
jan 1, 1984
20.854 bln
-1.566 bln
-6.98%
jan 1, 1985
21.203 bln
+349.118 mln
1.67%
jan 1, 1986
22.856 bln
+1.653 bln
7.8%
jan 1, 1987
28.844 bln
+5.989 bln
26.2%
jan 1, 1988
31.558 bln
+2.714 bln
9.41%
jan 1, 1989
33.552 bln
+1.994 bln
6.32%
jan 1, 1990
34.019 bln
+467.066 mln
1.39%
jan 1, 1991
38.911 bln
+4.892 bln
14.38%
jan 1, 1992
38.208 bln
-703.392 mln
-1.81%
jan 1, 1993
39.416 bln
+1.208 bln
3.16%
jan 1, 1994
36.784 bln
-2.632 bln
-6.68%
jan 1, 1995
39.585 bln
+2.801 bln
7.62%
jan 1, 1996
46.848 bln
+7.262 bln
18.35%
jan 1, 1997
50.544 bln
+3.696 bln
7.89%
jan 1, 1998
51.96 bln
+1.417 bln
2.8%
jan 1, 1999
53.647 bln
+1.687 bln
3.25%
jan 1, 2000
50.86 bln
-2.787 bln
-5.2%
jan 1, 2001
49.476 bln
-1.384 bln
-2.72%
jan 1, 2002
48.844 bln
-632.272 mln
-1.28%
jan 1, 2003
53.236 bln
+4.392 bln
8.99%
jan 1, 2004
61.073 bln
+7.837 bln
14.72%
jan 1, 2005
73.339 bln
+12.266 bln
20.08%
jan 1, 2006
83.872 bln
+10.533 bln
14.36%
jan 1, 2007
95.254 bln
+11.382 bln
13.57%
jan 1, 2008
119.633 bln
+24.379 bln
25.59%
jan 1, 2009
134.545 bln
+14.912 bln
12.46%
jan 1, 2010
105.199 bln
-29.347 bln
-21.81%
jan 1, 2011
120.111 bln
+14.912 bln
14.18%
jan 1, 2012
138.768 bln
+18.657 bln
15.53%
jan 1, 2013
140.255 bln
+1.487 bln
1.07%
jan 1, 2014
147.95 bln
+7.695 bln
5.49%
jan 1, 2015
148.771 bln
+821.014 mln
0.55%
jan 1, 2016
123.051 bln
-25.72 bln
-17.29%
Ranking of countries by current statistics by years


Comments: