29
/
en
AIzaSyAYiBZKx7MnpbEhh9jyipgxe19OcubqV5w
April 1, 2024
168710
Kiribati
KIR
true
2
1
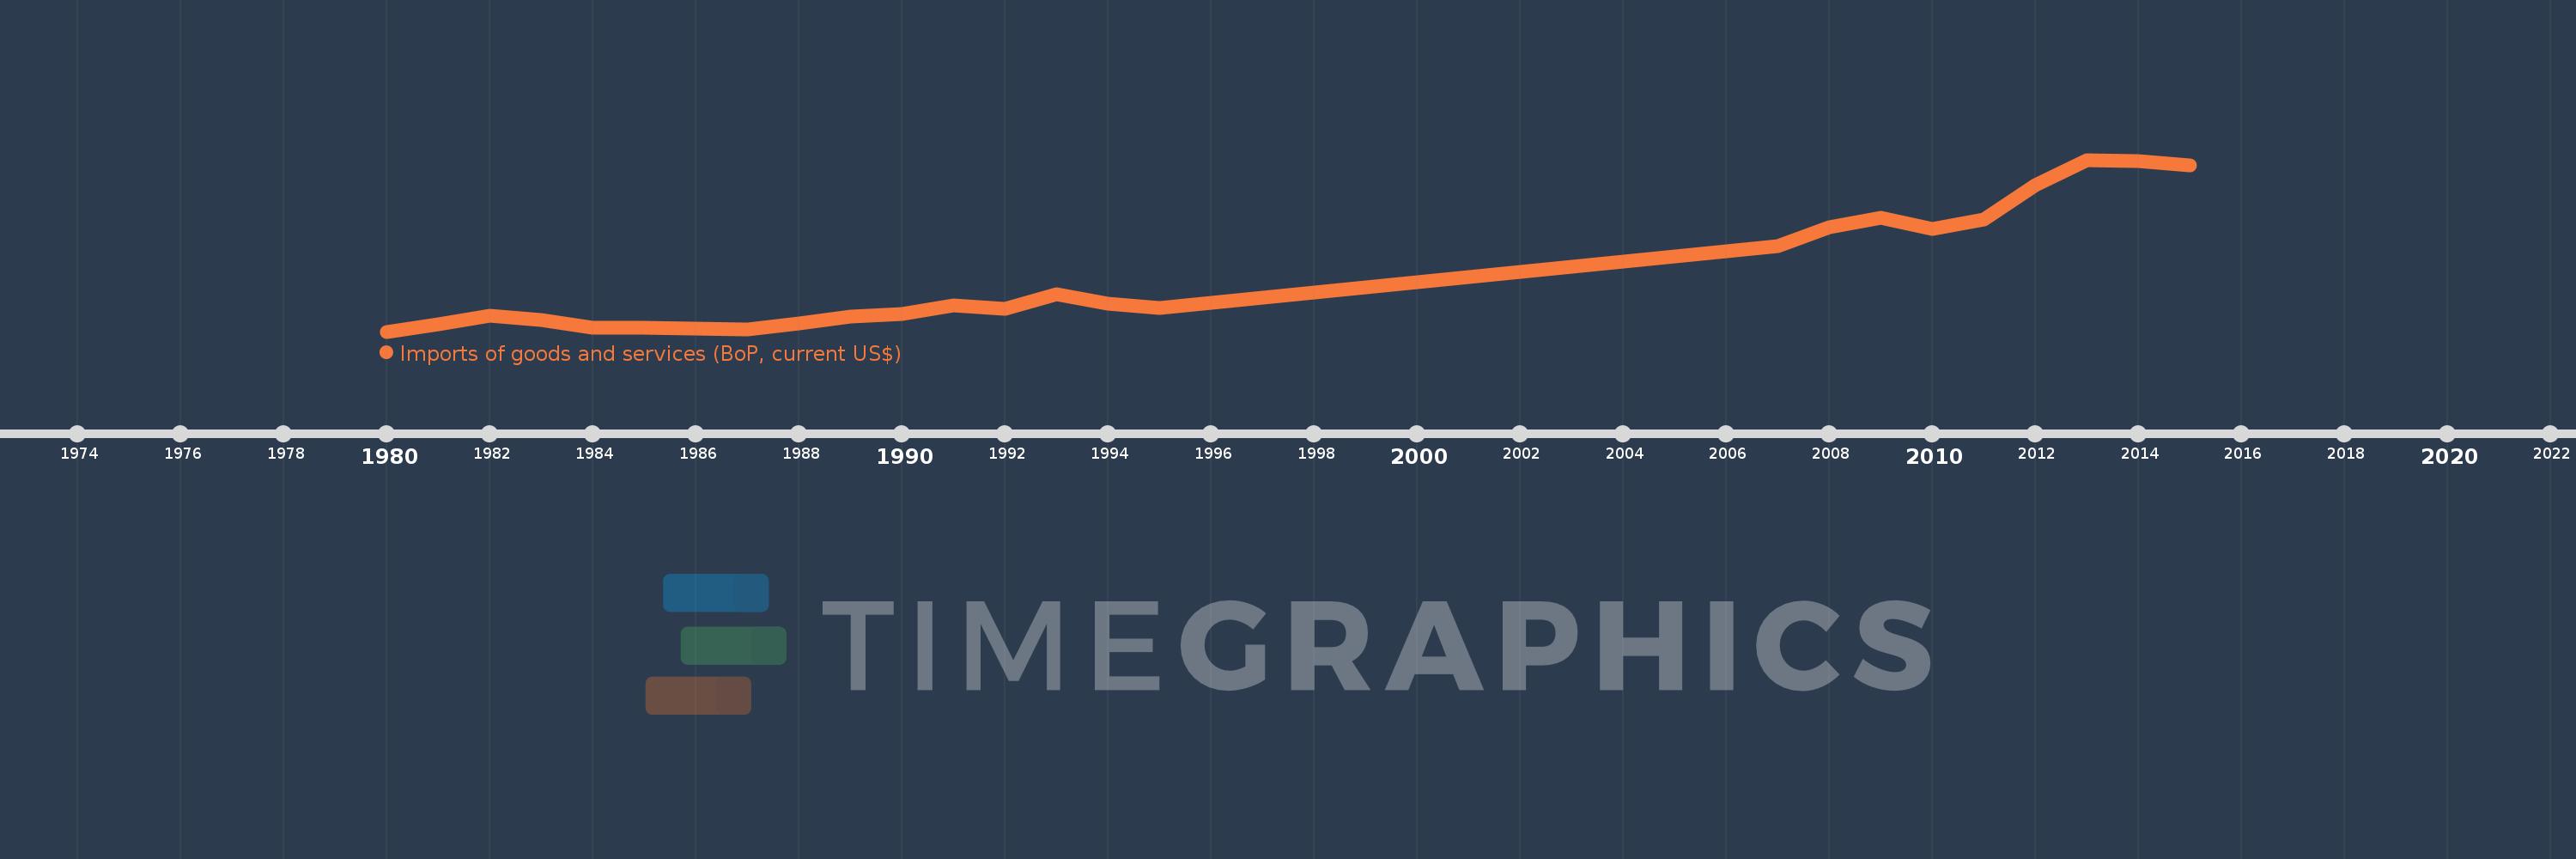
Imports of goods and services (BoP, current US$)
2015,2014,2013,2012,2011,2010,2009,2008,2007,1995,1994,1993,1992,1991,1990,1989,1988,1987,1986,1985,1984,1983,1982,1981,1980
This statistics in other country:
AfghanistanAlbaniaAlgeriaAngolaAntigua and BarbudaArab WorldArgentinaArmeniaArubaAustraliaAustriaAzerbaijanBahamas, TheBahrainBangladeshBarbadosBelarusBelgiumBelizeBeninBermudaBhutanBoliviaBosnia and HerzegovinaBotswanaBrazilBrunei DarussalamBulgariaBurkina FasoBurundiCabo VerdeCambodiaCameroonCanadaCaribbean small statesCentral African RepublicCentral Europe and the BalticsChadChileChinaColombiaComorosCongo, Dem. Rep.Congo, Rep.Costa RicaCote d'IvoireCroatiaCuracaoCyprusCzech RepublicDenmarkDjiboutiDominicaDominican RepublicEarly-demographic dividendEast Asia & PacificEast Asia & Pacific (excluding high income)East Asia & Pacific (IDA & IBRD countries)EcuadorEgypt, Arab Rep.El SalvadorEquatorial GuineaEritreaEstoniaEthiopiaEuro areaEurope & Central AsiaEurope & Central Asia (excluding high income)Europe & Central Asia (IDA & IBRD countries)European UnionFaroe IslandsFijiFinlandFragile and conflict affected situationsFranceFrench PolynesiaGabonGambia, TheGeorgiaGermanyGhanaGreeceGrenadaGuatemalaGuineaGuinea-BissauGuyanaHaitiHeavily indebted poor countries (HIPC)High incomeHondurasHong Kong SAR, ChinaHungaryIBRD onlyIcelandIDA & IBRD totalIDA blendIDA onlyIDA totalIndiaIndonesiaIran, Islamic Rep.IraqIrelandIsraelItalyJamaicaJapanJordanKazakhstanKenyaKiribatiKorea, Rep.KosovoKuwaitKyrgyz RepublicLao PDRLate-demographic dividendLatin America & Caribbean Latin America & Caribbean (excluding high income)Latin America & the Caribbean (IDA & IBRD countries)LatviaLeast developed countries: UN classificationLebanonLesothoLiberiaLibyaLithuaniaLow & middle incomeLow incomeLower middle incomeLuxembourgMacao SAR, ChinaMacedonia, FYRMadagascarMalawiMalaysiaMaldivesMaliMaltaMarshall IslandsMauritaniaMauritiusMexicoMicronesia, Fed. Sts.Middle East & North Africa (excluding high income)Middle East & North Africa (IDA & IBRD countries)Middle incomeMoldovaMongoliaMontenegroMoroccoMozambiqueMyanmarNamibiaNepalNetherlandsNew CaledoniaNicaraguaNigerNigeriaNorth AmericaNorwayOECD membersOmanOther small statesPacific island small statesPakistanPalauPanamaPapua New GuineaParaguayPeruPhilippinesPolandPortugalPost-demographic dividendPre-demographic dividendQatarRomaniaRussian FederationRwandaSamoaSao Tome and PrincipeSaudi ArabiaSenegalSerbiaSeychellesSierra LeoneSingaporeSint Maarten (Dutch part)Slovak RepublicSloveniaSmall statesSolomon IslandsSouth AfricaSouth AsiaSouth Asia (IDA & IBRD)South SudanSpainSri LankaSt. Kitts and NevisSt. LuciaSt. Vincent and the GrenadinesSub-Saharan Africa Sub-Saharan Africa (excluding high income)Sub-Saharan Africa (IDA & IBRD countries)SudanSurinameSwazilandSwedenSwitzerlandSyrian Arab RepublicTajikistanTanzaniaThailandTimor-LesteTogoTongaTrinidad and TobagoTunisiaTurkeyTuvaluUgandaUkraineUnited KingdomUnited StatesUpper middle incomeUruguayVanuatuVenezuela, RBVietnamWest Bank and GazaWorldYemen, Rep.ZambiaZimbabwe Timeline:
This timeline shows a graph from 1980 to 2015 of Kiribati. No data until 1979. Number of actual observations by date: 25.
Source name:
World Development Indicators
Source organization:
International Monetary Fund, Balance of Payments Statistics Yearbook and data files.
Categories, topics:
Economy & Growth, Trade
Last updated:
apr 23, 2017
Indicators value changes by year
Minimum:
23.568 mln
jan 1, 1980
Maximum:
174.96 mln
jan 1, 2013
At the date of observation
Value
Absolute change
Change from previous value
jan 1, 1980
23.568 mln
+23.568 mln
0.0%
jan 1, 1981
29.823 mln
+6.255 mln
26.54%
jan 1, 1982
37.755 mln
+7.932 mln
26.6%
jan 1, 1983
33.616 mln
-4.139 mln
-10.96%
jan 1, 1984
26.653 mln
-6.963 mln
-20.71%
jan 1, 1985
26.689 mln
+36.534K
0.14%
jan 1, 1986
26.294 mln
-395.5K
-1.48%
jan 1, 1987
25.595 mln
-699.134K
-2.66%
jan 1, 1988
30.974 mln
+5.38 mln
21.02%
jan 1, 1989
37.038 mln
+6.063 mln
19.58%
jan 1, 1990
39.204 mln
+2.166 mln
5.85%
jan 1, 1991
46.332 mln
+7.128 mln
18.18%
jan 1, 1992
43.846 mln
-2.486 mln
-5.37%
jan 1, 1993
56.659 mln
+12.813 mln
29.22%
jan 1, 1994
48.524 mln
-8.135 mln
-14.36%
jan 1, 1995
44.504 mln
-4.02 mln
-8.28%
jan 1, 2007
98.69 mln
+54.186 mln
121.76%
jan 1, 2008
115.847 mln
+17.157 mln
17.38%
jan 1, 2009
123.916 mln
+8.07 mln
6.97%
jan 1, 2010
114.012 mln
-9.904 mln
-7.99%
jan 1, 2011
122.629 mln
+8.616 mln
7.56%
jan 1, 2012
152.594 mln
+29.966 mln
24.44%
jan 1, 2013
174.96 mln
+22.365 mln
14.66%
jan 1, 2014
174.089 mln
-870.075K
-0.5%
jan 1, 2015
169.793 mln
-4.296 mln
-2.47%
Ranking of countries by current statistics by years


Comments: