29
/
en
AIzaSyAYiBZKx7MnpbEhh9jyipgxe19OcubqV5w
April 1, 2024
73090
Australia
AUS
true
2
1
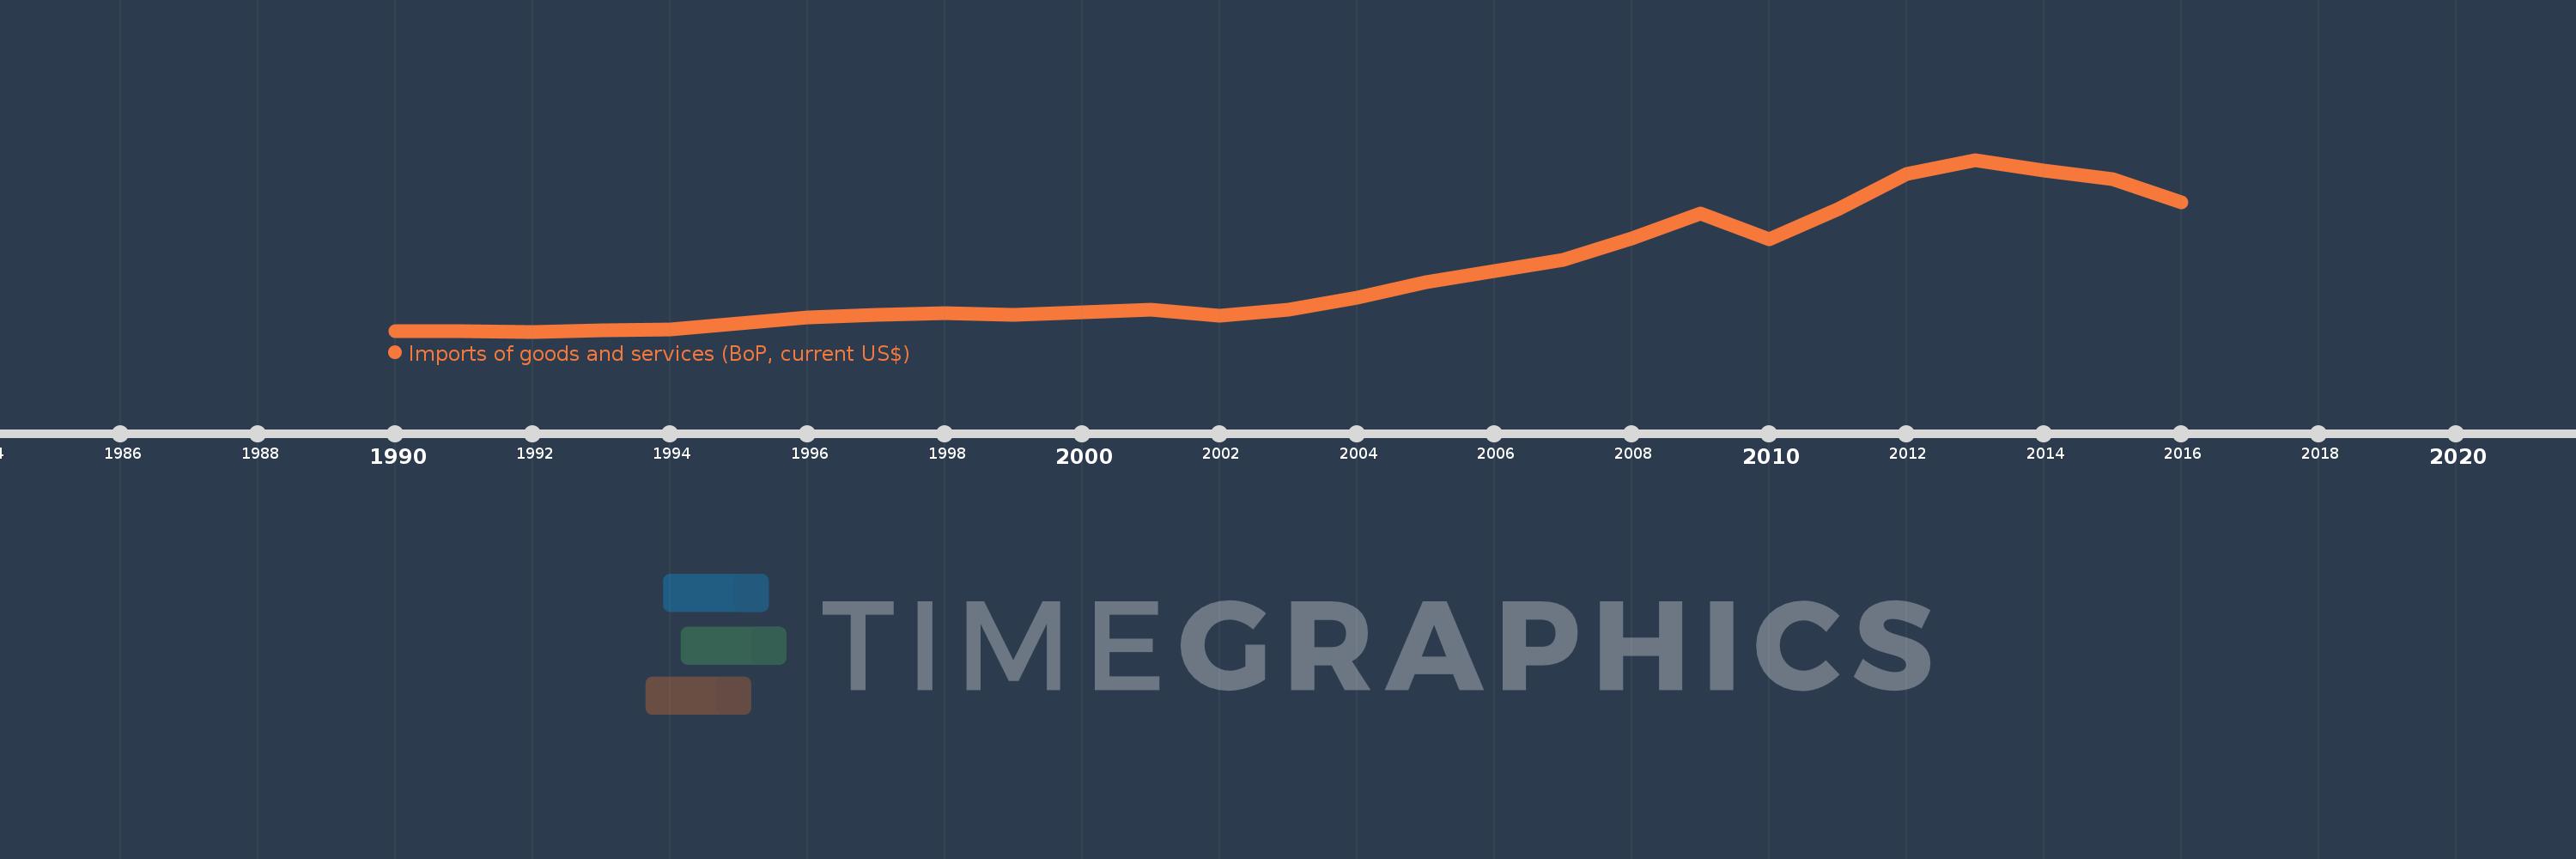
Imports of goods and services (BoP, current US$)
2016,2015,2014,2013,2012,2011,2010,2009,2008,2007,2006,2005,2004,2003,2002,2001,2000,1999,1998,1997,1996,1995,1994,1993,1992,1991,1990
This statistics in other country:
AfghanistanAlbaniaAlgeriaAngolaAntigua and BarbudaArab WorldArgentinaArmeniaArubaAustraliaAustriaAzerbaijanBahamas, TheBahrainBangladeshBarbadosBelarusBelgiumBelizeBeninBermudaBhutanBoliviaBosnia and HerzegovinaBotswanaBrazilBrunei DarussalamBulgariaBurkina FasoBurundiCabo VerdeCambodiaCameroonCanadaCaribbean small statesCentral African RepublicCentral Europe and the BalticsChadChileChinaColombiaComorosCongo, Dem. Rep.Congo, Rep.Costa RicaCote d'IvoireCroatiaCuracaoCyprusCzech RepublicDenmarkDjiboutiDominicaDominican RepublicEarly-demographic dividendEast Asia & PacificEast Asia & Pacific (excluding high income)East Asia & Pacific (IDA & IBRD countries)EcuadorEgypt, Arab Rep.El SalvadorEquatorial GuineaEritreaEstoniaEthiopiaEuro areaEurope & Central AsiaEurope & Central Asia (excluding high income)Europe & Central Asia (IDA & IBRD countries)European UnionFaroe IslandsFijiFinlandFragile and conflict affected situationsFranceFrench PolynesiaGabonGambia, TheGeorgiaGermanyGhanaGreeceGrenadaGuatemalaGuineaGuinea-BissauGuyanaHaitiHeavily indebted poor countries (HIPC)High incomeHondurasHong Kong SAR, ChinaHungaryIBRD onlyIcelandIDA & IBRD totalIDA blendIDA onlyIDA totalIndiaIndonesiaIran, Islamic Rep.IraqIrelandIsraelItalyJamaicaJapanJordanKazakhstanKenyaKiribatiKorea, Rep.KosovoKuwaitKyrgyz RepublicLao PDRLate-demographic dividendLatin America & Caribbean Latin America & Caribbean (excluding high income)Latin America & the Caribbean (IDA & IBRD countries)LatviaLeast developed countries: UN classificationLebanonLesothoLiberiaLibyaLithuaniaLow & middle incomeLow incomeLower middle incomeLuxembourgMacao SAR, ChinaMacedonia, FYRMadagascarMalawiMalaysiaMaldivesMaliMaltaMarshall IslandsMauritaniaMauritiusMexicoMicronesia, Fed. Sts.Middle East & North Africa (excluding high income)Middle East & North Africa (IDA & IBRD countries)Middle incomeMoldovaMongoliaMontenegroMoroccoMozambiqueMyanmarNamibiaNepalNetherlandsNew CaledoniaNicaraguaNigerNigeriaNorth AmericaNorwayOECD membersOmanOther small statesPacific island small statesPakistanPalauPanamaPapua New GuineaParaguayPeruPhilippinesPolandPortugalPost-demographic dividendPre-demographic dividendQatarRomaniaRussian FederationRwandaSamoaSao Tome and PrincipeSaudi ArabiaSenegalSerbiaSeychellesSierra LeoneSingaporeSint Maarten (Dutch part)Slovak RepublicSloveniaSmall statesSolomon IslandsSouth AfricaSouth AsiaSouth Asia (IDA & IBRD)South SudanSpainSri LankaSt. Kitts and NevisSt. LuciaSt. Vincent and the GrenadinesSub-Saharan Africa Sub-Saharan Africa (excluding high income)Sub-Saharan Africa (IDA & IBRD countries)SudanSurinameSwazilandSwedenSwitzerlandSyrian Arab RepublicTajikistanTanzaniaThailandTimor-LesteTogoTongaTrinidad and TobagoTunisiaTurkeyTuvaluUgandaUkraineUnited KingdomUnited StatesUpper middle incomeUruguayVanuatuVenezuela, RBVietnamWest Bank and GazaWorldYemen, Rep.ZambiaZimbabwe Timeline:
This timeline shows a graph from 1990 to 2016 of Australia. No data until 1989. Number of actual observations by date: 27.
Source name:
World Development Indicators
Source organization:
International Monetary Fund, Balance of Payments Statistics Yearbook and data files.
Categories, topics:
Economy & Growth, Trade
Last updated:
apr 23, 2017
Indicators value changes by year
Minimum:
52.68 bln
jan 1, 1992
Maximum:
335.325 bln
jan 1, 2013
At the date of observation
Value
Absolute change
Change from previous value
jan 1, 1990
53.993 bln
+53.993 bln
0.0%
jan 1, 1991
53.371 bln
-621.458 mln
-1.15%
jan 1, 1992
52.68 bln
-691.312 mln
-1.3%
jan 1, 1993
55.169 bln
+2.489 bln
4.72%
jan 1, 1994
56.603 bln
+1.434 bln
2.6%
jan 1, 1995
66.75 bln
+10.147 bln
17.93%
jan 1, 1996
75.423 bln
+8.673 bln
12.99%
jan 1, 1997
80.376 bln
+4.953 bln
6.57%
jan 1, 1998
82.747 bln
+2.371 bln
2.95%
jan 1, 1999
79.602 bln
-3.146 bln
-3.8%
jan 1, 2000
84.903 bln
+5.301 bln
6.66%
jan 1, 2001
88.268 bln
+3.365 bln
3.96%
jan 1, 2002
79.478 bln
-8.79 bln
-9.96%
jan 1, 2003
89.217 bln
+9.739 bln
12.25%
jan 1, 2004
108.505 bln
+19.288 bln
21.62%
jan 1, 2005
134.091 bln
+25.585 bln
23.58%
jan 1, 2006
152.262 bln
+18.171 bln
13.55%
jan 1, 2007
170.03 bln
+17.768 bln
11.67%
jan 1, 2008
205.831 bln
+35.801 bln
21.06%
jan 1, 2009
246.426 bln
+40.594 bln
19.72%
jan 1, 2010
205.141 bln
-41.285 bln
-16.75%
jan 1, 2011
254.064 bln
+48.923 bln
23.85%
jan 1, 2012
311.6 bln
+57.536 bln
22.65%
jan 1, 2013
335.325 bln
+23.725 bln
7.61%
jan 1, 2014
317.676 bln
-17.648 bln
-5.26%
jan 1, 2015
303.8 bln
-13.876 bln
-4.37%
jan 1, 2016
264.966 bln
-38.834 bln
-12.78%
Ranking of countries by current statistics by years


Comments: