29
/
en
AIzaSyAYiBZKx7MnpbEhh9jyipgxe19OcubqV5w
April 1, 2024
62686
World
WLD
false
2
1
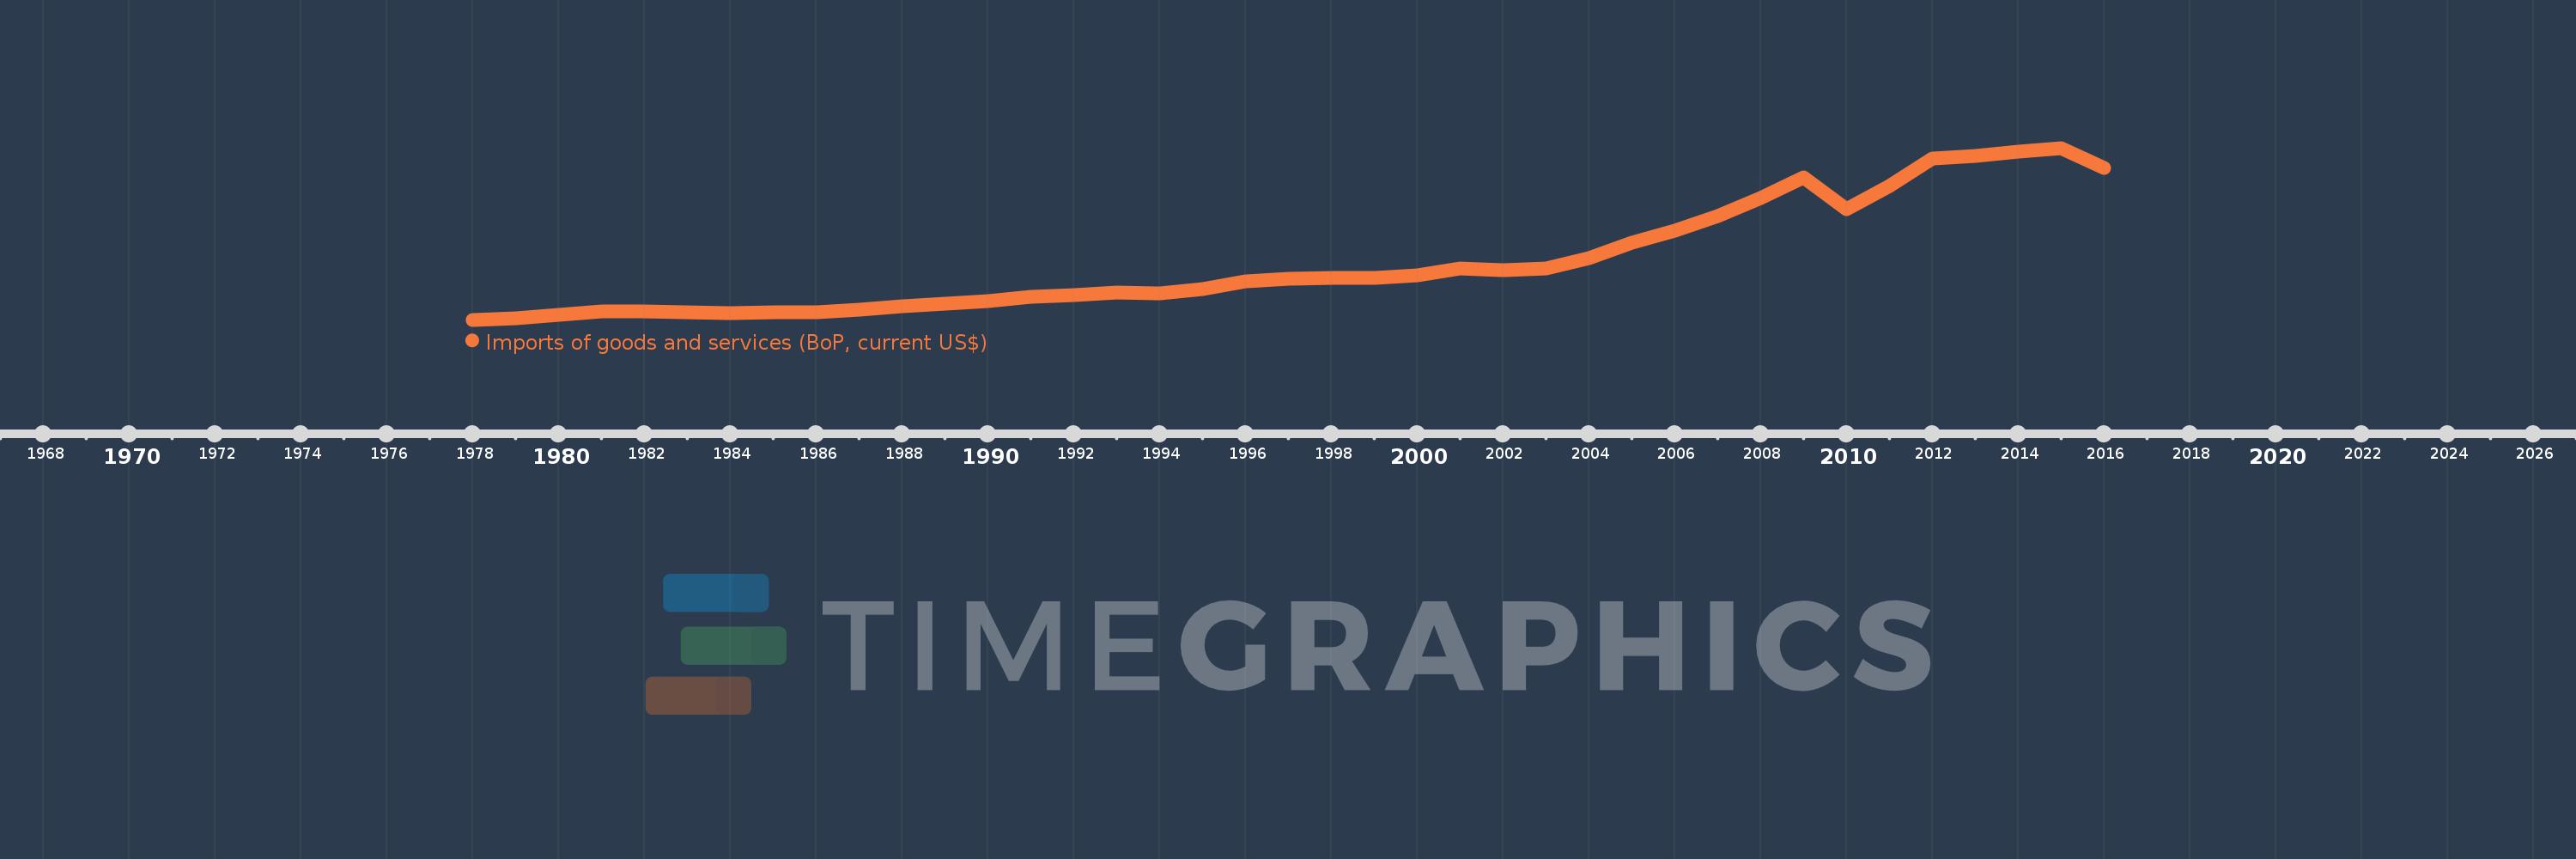
Imports of goods and services (BoP, current US$)
2016,2015,2014,2013,2012,2011,2010,2009,2008,2007,2006,2005,2004,2003,2002,2001,2000,1999,1998,1997,1996,1995,1994,1993,1992,1991,1990,1989,1988,1987,1986,1985,1984,1983,1982,1981,1980,1979,1978
This statistics in other country:
AfghanistanAlbaniaAlgeriaAngolaAntigua and BarbudaArab WorldArgentinaArmeniaArubaAustraliaAustriaAzerbaijanBahamas, TheBahrainBangladeshBarbadosBelarusBelgiumBelizeBeninBermudaBhutanBoliviaBosnia and HerzegovinaBotswanaBrazilBrunei DarussalamBulgariaBurkina FasoBurundiCabo VerdeCambodiaCameroonCanadaCaribbean small statesCentral African RepublicCentral Europe and the BalticsChadChileChinaColombiaComorosCongo, Dem. Rep.Congo, Rep.Costa RicaCote d'IvoireCroatiaCuracaoCyprusCzech RepublicDenmarkDjiboutiDominicaDominican RepublicEarly-demographic dividendEast Asia & PacificEast Asia & Pacific (excluding high income)East Asia & Pacific (IDA & IBRD countries)EcuadorEgypt, Arab Rep.El SalvadorEquatorial GuineaEritreaEstoniaEthiopiaEuro areaEurope & Central AsiaEurope & Central Asia (excluding high income)Europe & Central Asia (IDA & IBRD countries)European UnionFaroe IslandsFijiFinlandFragile and conflict affected situationsFranceFrench PolynesiaGabonGambia, TheGeorgiaGermanyGhanaGreeceGrenadaGuatemalaGuineaGuinea-BissauGuyanaHaitiHeavily indebted poor countries (HIPC)High incomeHondurasHong Kong SAR, ChinaHungaryIBRD onlyIcelandIDA & IBRD totalIDA blendIDA onlyIDA totalIndiaIndonesiaIran, Islamic Rep.IraqIrelandIsraelItalyJamaicaJapanJordanKazakhstanKenyaKiribatiKorea, Rep.KosovoKuwaitKyrgyz RepublicLao PDRLate-demographic dividendLatin America & Caribbean Latin America & Caribbean (excluding high income)Latin America & the Caribbean (IDA & IBRD countries)LatviaLeast developed countries: UN classificationLebanonLesothoLiberiaLibyaLithuaniaLow & middle incomeLow incomeLower middle incomeLuxembourgMacao SAR, ChinaMacedonia, FYRMadagascarMalawiMalaysiaMaldivesMaliMaltaMarshall IslandsMauritaniaMauritiusMexicoMicronesia, Fed. Sts.Middle East & North Africa (excluding high income)Middle East & North Africa (IDA & IBRD countries)Middle incomeMoldovaMongoliaMontenegroMoroccoMozambiqueMyanmarNamibiaNepalNetherlandsNew CaledoniaNicaraguaNigerNigeriaNorth AmericaNorwayOECD membersOmanOther small statesPacific island small statesPakistanPalauPanamaPapua New GuineaParaguayPeruPhilippinesPolandPortugalPost-demographic dividendPre-demographic dividendQatarRomaniaRussian FederationRwandaSamoaSao Tome and PrincipeSaudi ArabiaSenegalSerbiaSeychellesSierra LeoneSingaporeSint Maarten (Dutch part)Slovak RepublicSloveniaSmall statesSolomon IslandsSouth AfricaSouth AsiaSouth Asia (IDA & IBRD)South SudanSpainSri LankaSt. Kitts and NevisSt. LuciaSt. Vincent and the GrenadinesSub-Saharan Africa Sub-Saharan Africa (excluding high income)Sub-Saharan Africa (IDA & IBRD countries)SudanSurinameSwazilandSwedenSwitzerlandSyrian Arab RepublicTajikistanTanzaniaThailandTimor-LesteTogoTongaTrinidad and TobagoTunisiaTurkeyTuvaluUgandaUkraineUnited KingdomUnited StatesUpper middle incomeUruguayVanuatuVenezuela, RBVietnamWest Bank and GazaWorldYemen, Rep.ZambiaZimbabwe Timeline:
This timeline shows a graph from 1978 to 2016 of World. No data until 1977. Number of actual observations by date: 39.
Source name:
World Development Indicators
Source organization:
International Monetary Fund, Balance of Payments Statistics Yearbook and data files.
Categories, topics:
Economy & Growth, Trade
Last updated:
apr 23, 2017
Indicators value changes by year
Minimum:
1.369 trl
jan 1, 1978
Maximum:
23.196 trl
jan 1, 2015
At the date of observation
Value
Absolute change
Change from previous value
jan 1, 1978
1.369 trl
+1.369 trl
0.0%
jan 1, 1979
1.586 trl
+217.417 bln
15.88%
jan 1, 1980
1.993 trl
+406.29 bln
25.61%
jan 1, 1981
2.408 trl
+415.455 bln
20.85%
jan 1, 1982
2.417 trl
+8.371 bln
0.35%
jan 1, 1983
2.271 trl
-146.08 bln
-6.04%
jan 1, 1984
2.225 trl
-45.497 bln
-2.0%
jan 1, 1985
2.338 trl
+112.617 bln
5.06%
jan 1, 1986
2.366 trl
+28.13 bln
1.2%
jan 1, 1987
2.613 trl
+247.552 bln
10.46%
jan 1, 1988
3.058 trl
+444.289 bln
17.0%
jan 1, 1989
3.458 trl
+400.425 bln
13.1%
jan 1, 1990
3.735 trl
+277.211 bln
8.02%
jan 1, 1991
4.304 trl
+569.201 bln
15.24%
jan 1, 1992
4.46 trl
+155.945 bln
3.62%
jan 1, 1993
4.803 trl
+342.432 bln
7.68%
jan 1, 1994
4.723 trl
-79.983 bln
-1.67%
jan 1, 1995
5.245 trl
+522.363 bln
11.06%
jan 1, 1996
6.231 trl
+986.236 bln
18.8%
jan 1, 1997
6.575 trl
+343.378 bln
5.51%
jan 1, 1998
6.734 trl
+159.399 bln
2.42%
jan 1, 1999
6.708 trl
-26.316 bln
-0.39%
jan 1, 2000
7.015 trl
+307.549 bln
4.58%
jan 1, 2001
7.892 trl
+876.58 bln
12.5%
jan 1, 2002
7.629 trl
-262.814 bln
-3.33%
jan 1, 2003
7.888 trl
+258.623 bln
3.39%
jan 1, 2004
9.221 trl
+1.333 trl
16.9%
jan 1, 2005
11.209 trl
+1.988 trl
21.57%
jan 1, 2006
12.719 trl
+1.51 trl
13.47%
jan 1, 2007
14.548 trl
+1.828 trl
14.37%
jan 1, 2008
16.83 trl
+2.283 trl
15.69%
jan 1, 2009
19.442 trl
+2.612 trl
15.52%
jan 1, 2010
15.395 trl
-4.047 trl
-20.81%
jan 1, 2011
18.313 trl
+2.918 trl
18.95%
jan 1, 2012
21.823 trl
+3.511 trl
19.17%
jan 1, 2013
22.128 trl
+304.265 bln
1.39%
jan 1, 2014
22.704 trl
+576.433 bln
2.61%
jan 1, 2015
23.196 trl
+491.726 bln
2.17%
jan 1, 2016
20.613 trl
-2.583 trl
-11.14%
Ranking of countries by current statistics by years


Comments: