29
/
en
AIzaSyAYiBZKx7MnpbEhh9jyipgxe19OcubqV5w
April 1, 2024
57145
South Asia
SAS
false
2
1
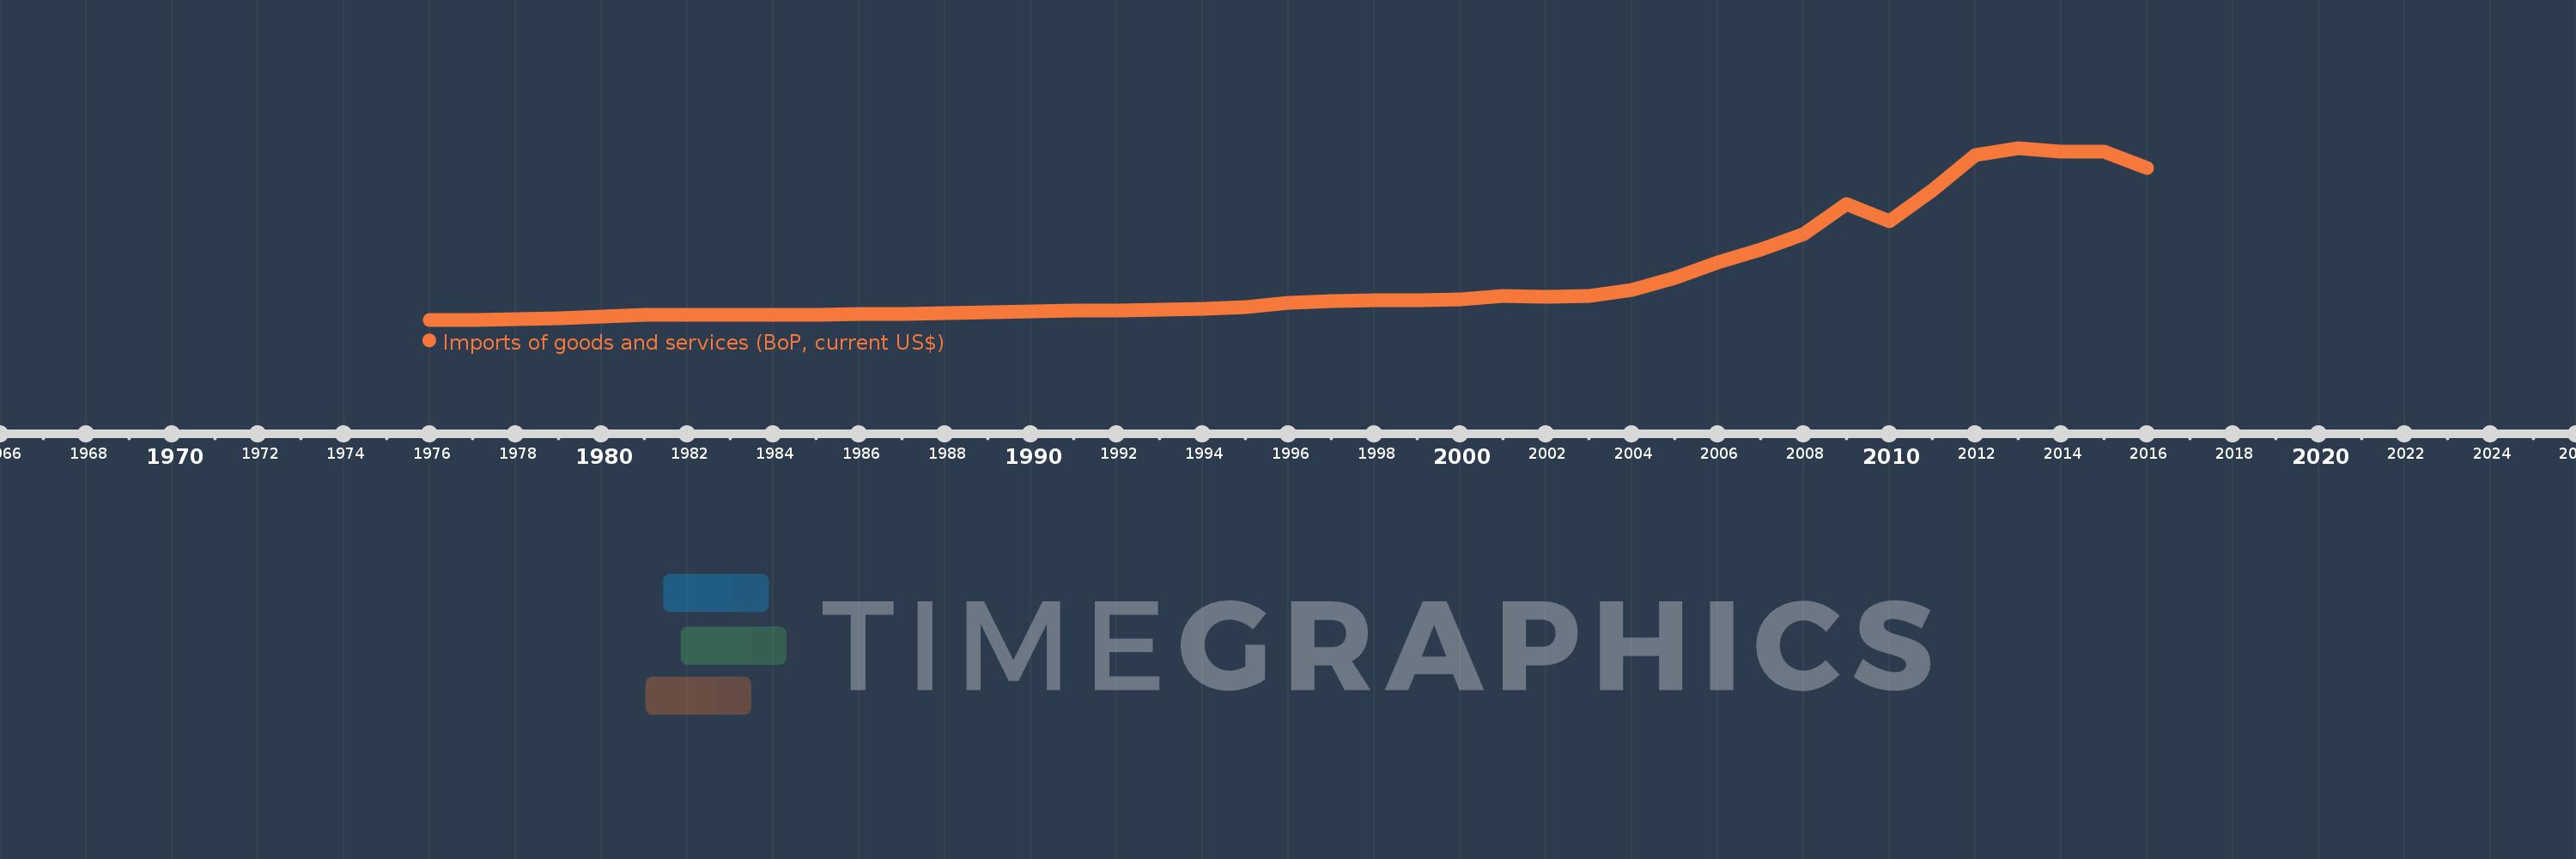
Imports of goods and services (BoP, current US$)
2016,2015,2014,2013,2012,2011,2010,2009,2008,2007,2006,2005,2004,2003,2002,2001,2000,1999,1998,1997,1996,1995,1994,1993,1992,1991,1990,1989,1988,1987,1986,1985,1984,1983,1982,1981,1980,1979,1978,1977,1976
This statistics in other country:
AfghanistanAlbaniaAlgeriaAngolaAntigua and BarbudaArab WorldArgentinaArmeniaArubaAustraliaAustriaAzerbaijanBahamas, TheBahrainBangladeshBarbadosBelarusBelgiumBelizeBeninBermudaBhutanBoliviaBosnia and HerzegovinaBotswanaBrazilBrunei DarussalamBulgariaBurkina FasoBurundiCabo VerdeCambodiaCameroonCanadaCaribbean small statesCentral African RepublicCentral Europe and the BalticsChadChileChinaColombiaComorosCongo, Dem. Rep.Congo, Rep.Costa RicaCote d'IvoireCroatiaCuracaoCyprusCzech RepublicDenmarkDjiboutiDominicaDominican RepublicEarly-demographic dividendEast Asia & PacificEast Asia & Pacific (excluding high income)East Asia & Pacific (IDA & IBRD countries)EcuadorEgypt, Arab Rep.El SalvadorEquatorial GuineaEritreaEstoniaEthiopiaEuro areaEurope & Central AsiaEurope & Central Asia (excluding high income)Europe & Central Asia (IDA & IBRD countries)European UnionFaroe IslandsFijiFinlandFragile and conflict affected situationsFranceFrench PolynesiaGabonGambia, TheGeorgiaGermanyGhanaGreeceGrenadaGuatemalaGuineaGuinea-BissauGuyanaHaitiHeavily indebted poor countries (HIPC)High incomeHondurasHong Kong SAR, ChinaHungaryIBRD onlyIcelandIDA & IBRD totalIDA blendIDA onlyIDA totalIndiaIndonesiaIran, Islamic Rep.IraqIrelandIsraelItalyJamaicaJapanJordanKazakhstanKenyaKiribatiKorea, Rep.KosovoKuwaitKyrgyz RepublicLao PDRLate-demographic dividendLatin America & Caribbean Latin America & Caribbean (excluding high income)Latin America & the Caribbean (IDA & IBRD countries)LatviaLeast developed countries: UN classificationLebanonLesothoLiberiaLibyaLithuaniaLow & middle incomeLow incomeLower middle incomeLuxembourgMacao SAR, ChinaMacedonia, FYRMadagascarMalawiMalaysiaMaldivesMaliMaltaMarshall IslandsMauritaniaMauritiusMexicoMicronesia, Fed. Sts.Middle East & North Africa (excluding high income)Middle East & North Africa (IDA & IBRD countries)Middle incomeMoldovaMongoliaMontenegroMoroccoMozambiqueMyanmarNamibiaNepalNetherlandsNew CaledoniaNicaraguaNigerNigeriaNorth AmericaNorwayOECD membersOmanOther small statesPacific island small statesPakistanPalauPanamaPapua New GuineaParaguayPeruPhilippinesPolandPortugalPost-demographic dividendPre-demographic dividendQatarRomaniaRussian FederationRwandaSamoaSao Tome and PrincipeSaudi ArabiaSenegalSerbiaSeychellesSierra LeoneSingaporeSint Maarten (Dutch part)Slovak RepublicSloveniaSmall statesSolomon IslandsSouth AfricaSouth AsiaSouth Asia (IDA & IBRD)South SudanSpainSri LankaSt. Kitts and NevisSt. LuciaSt. Vincent and the GrenadinesSub-Saharan Africa Sub-Saharan Africa (excluding high income)Sub-Saharan Africa (IDA & IBRD countries)SudanSurinameSwazilandSwedenSwitzerlandSyrian Arab RepublicTajikistanTanzaniaThailandTimor-LesteTogoTongaTrinidad and TobagoTunisiaTurkeyTuvaluUgandaUkraineUnited KingdomUnited StatesUpper middle incomeUruguayVanuatuVenezuela, RBVietnamWest Bank and GazaWorldYemen, Rep.ZambiaZimbabwe Timeline:
This timeline shows a graph from 1976 to 2016 of South Asia. No data until 1975. Number of actual observations by date: 41.
Source name:
World Development Indicators
Source organization:
International Monetary Fund, Balance of Payments Statistics Yearbook and data files.
Categories, topics:
Economy & Growth, Trade
Last updated:
apr 23, 2017
Indicators value changes by year
Minimum:
10.619 bln
jan 1, 1977
Maximum:
708.738 bln
jan 1, 2013
At the date of observation
Value
Absolute change
Change from previous value
jan 1, 1976
11.218 bln
+11.218 bln
0.0%
jan 1, 1977
10.619 bln
-599.078 mln
-5.34%
jan 1, 1978
12.223 bln
+1.604 bln
15.1%
jan 1, 1979
16.356 bln
+4.133 bln
33.82%
jan 1, 1980
21.815 bln
+5.459 bln
33.38%
jan 1, 1981
29.719 bln
+7.904 bln
36.23%
jan 1, 1982
30.554 bln
+834.654 mln
2.81%
jan 1, 1983
30.632 bln
+78.348 mln
0.26%
jan 1, 1984
30.336 bln
-296.726 mln
-0.97%
jan 1, 1985
32.104 bln
+1.769 bln
5.83%
jan 1, 1986
32.847 bln
+742.162 mln
2.31%
jan 1, 1987
33.848 bln
+1.001 bln
3.05%
jan 1, 1988
36.99 bln
+3.142 bln
9.28%
jan 1, 1989
41.722 bln
+4.731 bln
12.79%
jan 1, 1990
45.46 bln
+3.739 bln
8.96%
jan 1, 1991
48.412 bln
+2.952 bln
6.49%
jan 1, 1992
47.238 bln
-1.174 bln
-2.42%
jan 1, 1993
52.062 bln
+4.824 bln
10.21%
jan 1, 1994
53.808 bln
+1.746 bln
3.35%
jan 1, 1995
63.187 bln
+9.379 bln
17.43%
jan 1, 1996
79.164 bln
+15.977 bln
25.29%
jan 1, 1997
87.603 bln
+8.439 bln
10.66%
jan 1, 1998
89.727 bln
+2.124 bln
2.42%
jan 1, 1999
89.243 bln
-484.424 mln
-0.54%
jan 1, 2000
93.749 bln
+4.506 bln
5.05%
jan 1, 2001
106.803 bln
+13.054 bln
13.92%
jan 1, 2002
103.836 bln
-2.967 bln
-2.78%
jan 1, 2003
108.33 bln
+4.495 bln
4.33%
jan 1, 2004
131.459 bln
+23.129 bln
21.35%
jan 1, 2005
180.931 bln
+49.472 bln
37.63%
jan 1, 2006
243.671 bln
+62.74 bln
34.68%
jan 1, 2007
297.25 bln
+53.579 bln
21.99%
jan 1, 2008
359.629 bln
+62.379 bln
20.99%
jan 1, 2009
482.265 bln
+122.636 bln
34.1%
jan 1, 2010
409.47 bln
-72.796 bln
-15.09%
jan 1, 2011
538.332 bln
+128.862 bln
31.47%
jan 1, 2012
678.156 bln
+139.824 bln
25.97%
jan 1, 2013
708.738 bln
+30.582 bln
4.51%
jan 1, 2014
693.188 bln
-15.55 bln
-2.19%
jan 1, 2015
694.191 bln
+1.003 bln
0.14%
jan 1, 2016
627.927 bln
-66.264 bln
-9.55%
Ranking of countries by current statistics by years


Comments: