29
/
en
AIzaSyAYiBZKx7MnpbEhh9jyipgxe19OcubqV5w
April 1, 2024
106100
China
CHN
true
2
1
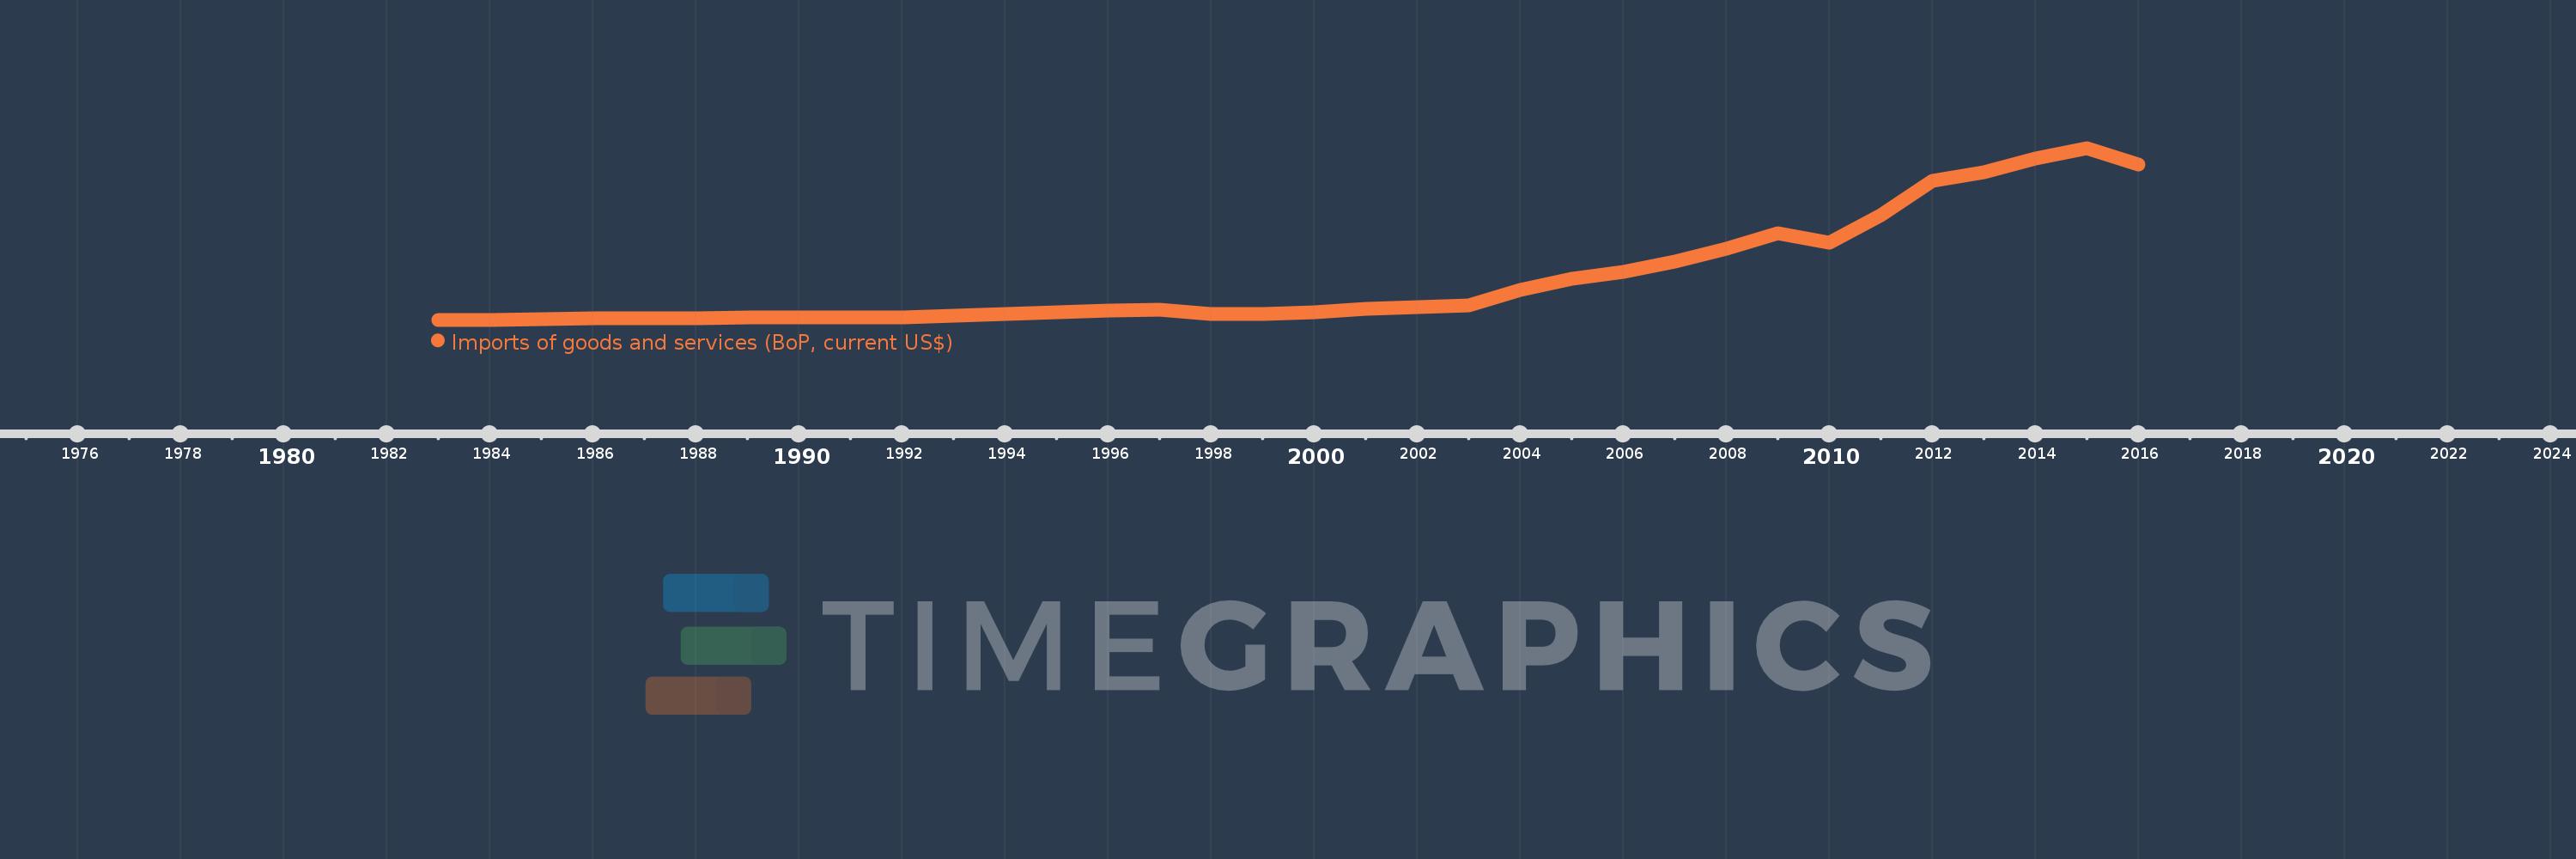
Imports of goods and services (BoP, current US$)
2016,2015,2014,2013,2012,2011,2010,2009,2008,2007,2006,2005,2004,2003,2002,2001,2000,1999,1998,1997,1996,1995,1994,1993,1992,1991,1990,1989,1988,1987,1986,1985,1984,1983
This statistics in other country:
AfghanistanAlbaniaAlgeriaAngolaAntigua and BarbudaArab WorldArgentinaArmeniaArubaAustraliaAustriaAzerbaijanBahamas, TheBahrainBangladeshBarbadosBelarusBelgiumBelizeBeninBermudaBhutanBoliviaBosnia and HerzegovinaBotswanaBrazilBrunei DarussalamBulgariaBurkina FasoBurundiCabo VerdeCambodiaCameroonCanadaCaribbean small statesCentral African RepublicCentral Europe and the BalticsChadChileChinaColombiaComorosCongo, Dem. Rep.Congo, Rep.Costa RicaCote d'IvoireCroatiaCuracaoCyprusCzech RepublicDenmarkDjiboutiDominicaDominican RepublicEarly-demographic dividendEast Asia & PacificEast Asia & Pacific (excluding high income)East Asia & Pacific (IDA & IBRD countries)EcuadorEgypt, Arab Rep.El SalvadorEquatorial GuineaEritreaEstoniaEthiopiaEuro areaEurope & Central AsiaEurope & Central Asia (excluding high income)Europe & Central Asia (IDA & IBRD countries)European UnionFaroe IslandsFijiFinlandFragile and conflict affected situationsFranceFrench PolynesiaGabonGambia, TheGeorgiaGermanyGhanaGreeceGrenadaGuatemalaGuineaGuinea-BissauGuyanaHaitiHeavily indebted poor countries (HIPC)High incomeHondurasHong Kong SAR, ChinaHungaryIBRD onlyIcelandIDA & IBRD totalIDA blendIDA onlyIDA totalIndiaIndonesiaIran, Islamic Rep.IraqIrelandIsraelItalyJamaicaJapanJordanKazakhstanKenyaKiribatiKorea, Rep.KosovoKuwaitKyrgyz RepublicLao PDRLate-demographic dividendLatin America & Caribbean Latin America & Caribbean (excluding high income)Latin America & the Caribbean (IDA & IBRD countries)LatviaLeast developed countries: UN classificationLebanonLesothoLiberiaLibyaLithuaniaLow & middle incomeLow incomeLower middle incomeLuxembourgMacao SAR, ChinaMacedonia, FYRMadagascarMalawiMalaysiaMaldivesMaliMaltaMarshall IslandsMauritaniaMauritiusMexicoMicronesia, Fed. Sts.Middle East & North Africa (excluding high income)Middle East & North Africa (IDA & IBRD countries)Middle incomeMoldovaMongoliaMontenegroMoroccoMozambiqueMyanmarNamibiaNepalNetherlandsNew CaledoniaNicaraguaNigerNigeriaNorth AmericaNorwayOECD membersOmanOther small statesPacific island small statesPakistanPalauPanamaPapua New GuineaParaguayPeruPhilippinesPolandPortugalPost-demographic dividendPre-demographic dividendQatarRomaniaRussian FederationRwandaSamoaSao Tome and PrincipeSaudi ArabiaSenegalSerbiaSeychellesSierra LeoneSingaporeSint Maarten (Dutch part)Slovak RepublicSloveniaSmall statesSolomon IslandsSouth AfricaSouth AsiaSouth Asia (IDA & IBRD)South SudanSpainSri LankaSt. Kitts and NevisSt. LuciaSt. Vincent and the GrenadinesSub-Saharan Africa Sub-Saharan Africa (excluding high income)Sub-Saharan Africa (IDA & IBRD countries)SudanSurinameSwazilandSwedenSwitzerlandSyrian Arab RepublicTajikistanTanzaniaThailandTimor-LesteTogoTongaTrinidad and TobagoTunisiaTurkeyTuvaluUgandaUkraineUnited KingdomUnited StatesUpper middle incomeUruguayVanuatuVenezuela, RBVietnamWest Bank and GazaWorldYemen, Rep.ZambiaZimbabwe Timeline:
This timeline shows a graph from 1983 to 2016 of China. No data until 1982. Number of actual observations by date: 34.
Source name:
World Development Indicators
Source organization:
International Monetary Fund, Balance of Payments Statistics Yearbook and data files.
Categories, topics:
Economy & Growth, Trade
Last updated:
apr 23, 2017
Indicators value changes by year
Minimum:
18.9 bln
jan 1, 1983
Maximum:
2.262 trl
jan 1, 2015
At the date of observation
Value
Absolute change
Change from previous value
jan 1, 1983
18.9 bln
+18.9 bln
0.0%
jan 1, 1984
20.711 bln
+1.811 bln
9.58%
jan 1, 1985
26.748 bln
+6.037 bln
29.15%
jan 1, 1986
40.755 bln
+14.007 bln
52.37%
jan 1, 1987
37.172 bln
-3.583 bln
-8.79%
jan 1, 1988
38.88 bln
+1.708 bln
4.59%
jan 1, 1989
49.972 bln
+11.092 bln
28.53%
jan 1, 1990
52.75 bln
+2.778 bln
5.56%
jan 1, 1991
46.706 bln
-6.044 bln
-11.46%
jan 1, 1992
54.297 bln
+7.591 bln
16.25%
jan 1, 1993
73.819 bln
+19.522 bln
35.95%
jan 1, 1994
98.349 bln
+24.53 bln
33.23%
jan 1, 1995
111.57 bln
+13.221 bln
13.44%
jan 1, 1996
135.282 bln
+23.712 bln
21.25%
jan 1, 1997
154.127 bln
+18.845 bln
13.93%
jan 1, 1998
97.709 bln
-56.418 bln
-36.6%
jan 1, 1999
97.527 bln
-182.0 mln
-0.19%
jan 1, 2000
119.243 bln
+21.716 bln
22.27%
jan 1, 2001
161.166 bln
+41.923 bln
35.16%
jan 1, 2002
180.488 bln
+19.322 bln
11.99%
jan 1, 2003
210.243 bln
+29.755 bln
16.49%
jan 1, 2004
410.155 bln
+199.912 bln
95.09%
jan 1, 2005
553.6 bln
+143.445 bln
34.97%
jan 1, 2006
648.712 bln
+95.112 bln
17.18%
jan 1, 2007
782.812 bln
+134.1 bln
20.67%
jan 1, 2008
949.017 bln
+166.204 bln
21.23%
jan 1, 2009
1.146 trl
+197.468 bln
20.81%
jan 1, 2010
1.03 trl
-116.891 bln
-10.2%
jan 1, 2011
1.381 trl
+351.327 bln
34.12%
jan 1, 2012
1.827 trl
+446.028 bln
32.3%
jan 1, 2013
1.943 trl
+116.298 bln
6.37%
jan 1, 2014
2.12 trl
+176.968 bln
9.11%
jan 1, 2015
2.262 trl
+141.337 bln
6.67%
jan 1, 2016
2.045 trl
-216.9 bln
-9.59%
Ranking of countries by current statistics by years


Comments: