29
/
en
AIzaSyAYiBZKx7MnpbEhh9jyipgxe19OcubqV5w
April 1, 2024
44333
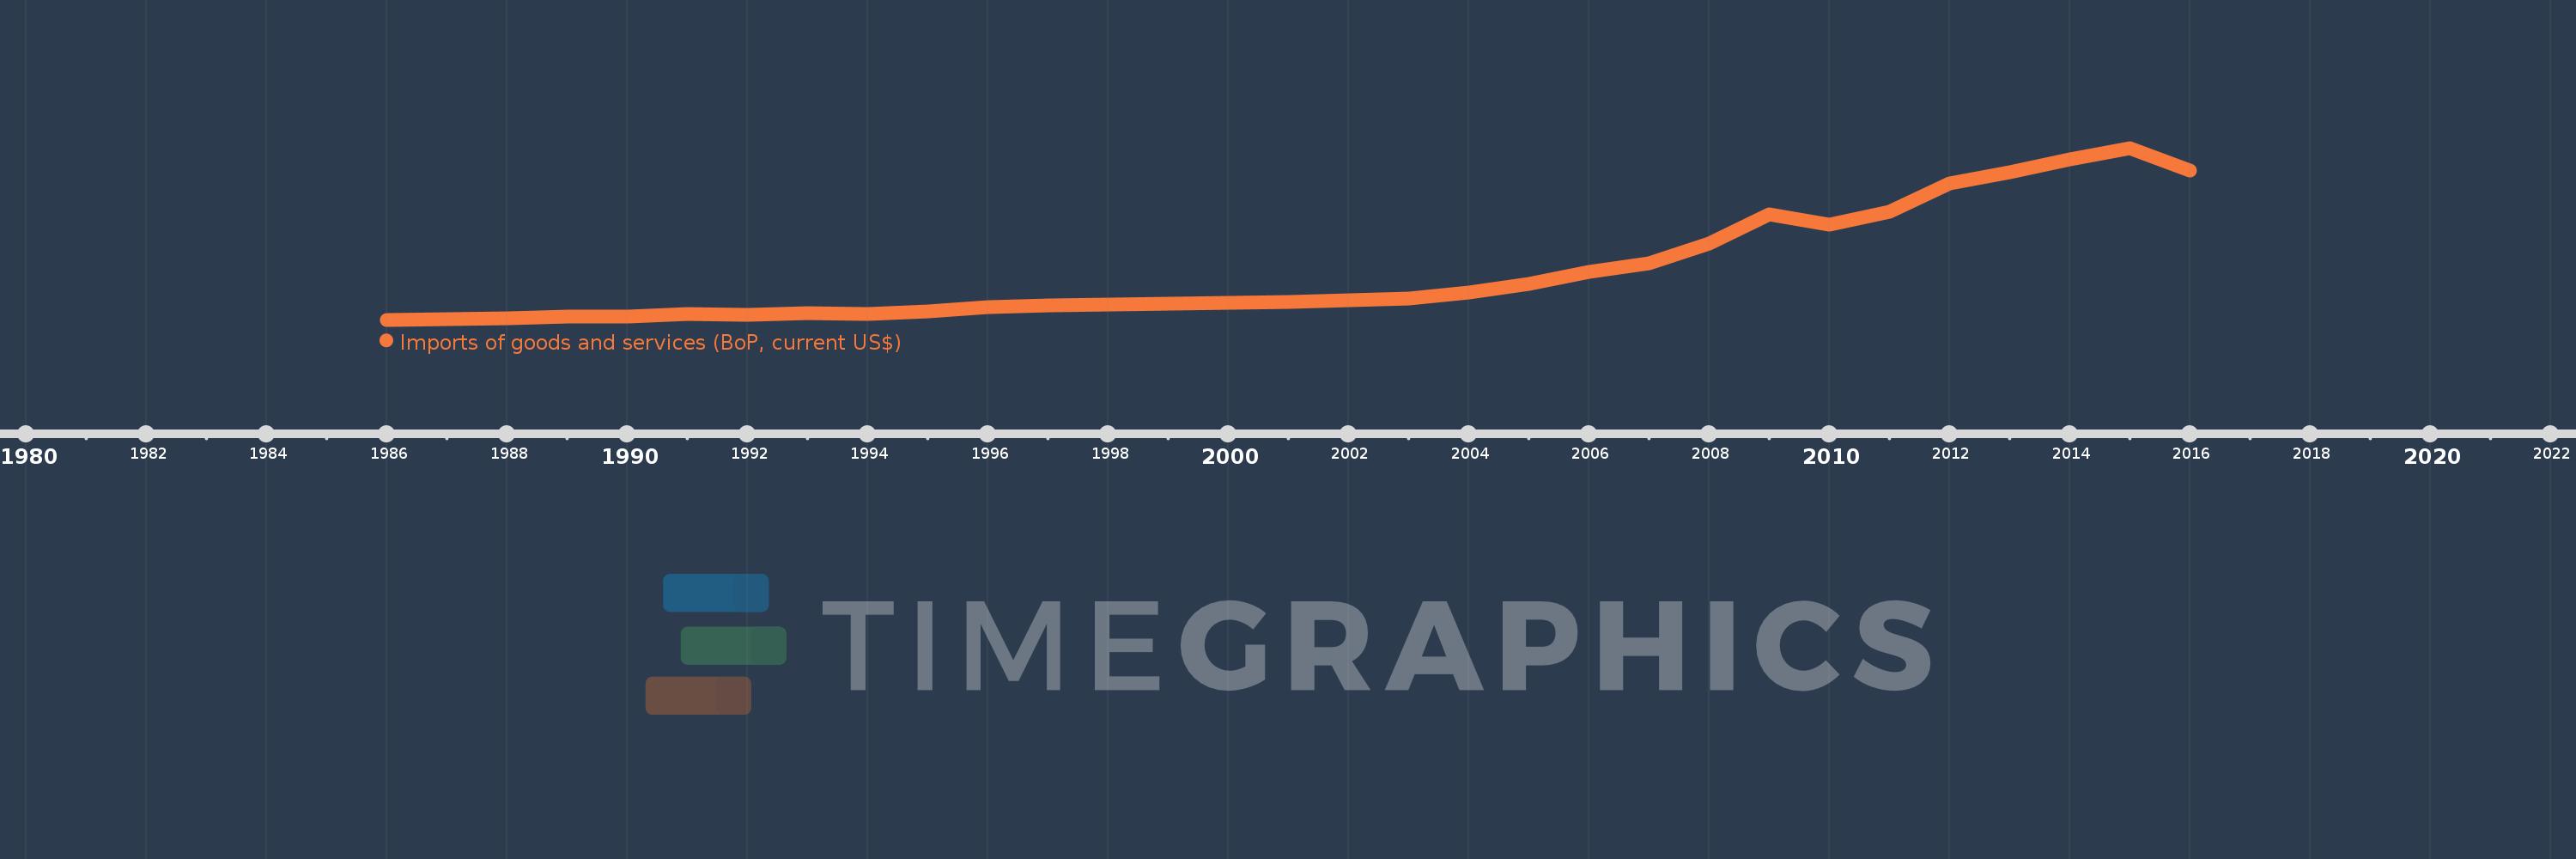
Least developed countries: UN classification
LDC
false
2
1
Imports of goods and services (BoP, current US$)
2016,2015,2014,2013,2012,2011,2010,2009,2008,2007,2006,2005,2004,2003,2002,2001,2000,1999,1998,1997,1996,1995,1994,1993,1992,1991,1990,1989,1988,1987,1986
This statistics in other country:
AfghanistanAlbaniaAlgeriaAngolaAntigua and BarbudaArab WorldArgentinaArmeniaArubaAustraliaAustriaAzerbaijanBahamas, TheBahrainBangladeshBarbadosBelarusBelgiumBelizeBeninBermudaBhutanBoliviaBosnia and HerzegovinaBotswanaBrazilBrunei DarussalamBulgariaBurkina FasoBurundiCabo VerdeCambodiaCameroonCanadaCaribbean small statesCentral African RepublicCentral Europe and the BalticsChadChileChinaColombiaComorosCongo, Dem. Rep.Congo, Rep.Costa RicaCote d'IvoireCroatiaCuracaoCyprusCzech RepublicDenmarkDjiboutiDominicaDominican RepublicEarly-demographic dividendEast Asia & PacificEast Asia & Pacific (excluding high income)East Asia & Pacific (IDA & IBRD countries)EcuadorEgypt, Arab Rep.El SalvadorEquatorial GuineaEritreaEstoniaEthiopiaEuro areaEurope & Central AsiaEurope & Central Asia (excluding high income)Europe & Central Asia (IDA & IBRD countries)European UnionFaroe IslandsFijiFinlandFragile and conflict affected situationsFranceFrench PolynesiaGabonGambia, TheGeorgiaGermanyGhanaGreeceGrenadaGuatemalaGuineaGuinea-BissauGuyanaHaitiHeavily indebted poor countries (HIPC)High incomeHondurasHong Kong SAR, ChinaHungaryIBRD onlyIcelandIDA & IBRD totalIDA blendIDA onlyIDA totalIndiaIndonesiaIran, Islamic Rep.IraqIrelandIsraelItalyJamaicaJapanJordanKazakhstanKenyaKiribatiKorea, Rep.KosovoKuwaitKyrgyz RepublicLao PDRLate-demographic dividendLatin America & Caribbean Latin America & Caribbean (excluding high income)Latin America & the Caribbean (IDA & IBRD countries)LatviaLeast developed countries: UN classificationLebanonLesothoLiberiaLibyaLithuaniaLow & middle incomeLow incomeLower middle incomeLuxembourgMacao SAR, ChinaMacedonia, FYRMadagascarMalawiMalaysiaMaldivesMaliMaltaMarshall IslandsMauritaniaMauritiusMexicoMicronesia, Fed. Sts.Middle East & North Africa (excluding high income)Middle East & North Africa (IDA & IBRD countries)Middle incomeMoldovaMongoliaMontenegroMoroccoMozambiqueMyanmarNamibiaNepalNetherlandsNew CaledoniaNicaraguaNigerNigeriaNorth AmericaNorwayOECD membersOmanOther small statesPacific island small statesPakistanPalauPanamaPapua New GuineaParaguayPeruPhilippinesPolandPortugalPost-demographic dividendPre-demographic dividendQatarRomaniaRussian FederationRwandaSamoaSao Tome and PrincipeSaudi ArabiaSenegalSerbiaSeychellesSierra LeoneSingaporeSint Maarten (Dutch part)Slovak RepublicSloveniaSmall statesSolomon IslandsSouth AfricaSouth AsiaSouth Asia (IDA & IBRD)South SudanSpainSri LankaSt. Kitts and NevisSt. LuciaSt. Vincent and the GrenadinesSub-Saharan Africa Sub-Saharan Africa (excluding high income)Sub-Saharan Africa (IDA & IBRD countries)SudanSurinameSwazilandSwedenSwitzerlandSyrian Arab RepublicTajikistanTanzaniaThailandTimor-LesteTogoTongaTrinidad and TobagoTunisiaTurkeyTuvaluUgandaUkraineUnited KingdomUnited StatesUpper middle incomeUruguayVanuatuVenezuela, RBVietnamWest Bank and GazaWorldYemen, Rep.ZambiaZimbabwe Timeline:
This timeline shows a graph from 1986 to 2016 of Least developed countries: UN classification. No data until 1985. Number of actual observations by date: 31.
Source name:
World Development Indicators
Source organization:
International Monetary Fund, Balance of Payments Statistics Yearbook and data files.
Categories, topics:
Economy & Growth, Trade
Last updated:
apr 23, 2017
Indicators value changes by year
Minimum:
24.846 bln
jan 1, 1986
Maximum:
336.369 bln
jan 1, 2015
At the date of observation
Value
Absolute change
Change from previous value
jan 1, 1986
24.846 bln
+24.846 bln
0.0%
jan 1, 1987
25.824 bln
+977.751 mln
3.94%
jan 1, 1988
27.202 bln
+1.378 bln
5.34%
jan 1, 1989
29.97 bln
+2.768 bln
10.18%
jan 1, 1990
30.786 bln
+815.763 mln
2.72%
jan 1, 1991
35.049 bln
+4.263 bln
13.85%
jan 1, 1992
34.006 bln
-1.043 bln
-2.98%
jan 1, 1993
36.678 bln
+2.671 bln
7.86%
jan 1, 1994
35.948 bln
-730.279 mln
-1.99%
jan 1, 1995
39.452 bln
+3.505 bln
9.75%
jan 1, 1996
48.102 bln
+8.65 bln
21.92%
jan 1, 1997
50.418 bln
+2.316 bln
4.81%
jan 1, 1998
52.286 bln
+1.867 bln
3.7%
jan 1, 1999
53.416 bln
+1.13 bln
2.16%
jan 1, 2000
55.418 bln
+2.002 bln
3.75%
jan 1, 2001
57.411 bln
+1.993 bln
3.6%
jan 1, 2002
60.618 bln
+3.207 bln
5.59%
jan 1, 2003
62.701 bln
+2.083 bln
3.44%
jan 1, 2004
73.849 bln
+11.147 bln
17.78%
jan 1, 2005
89.252 bln
+15.404 bln
20.86%
jan 1, 2006
110.87 bln
+21.618 bln
24.22%
jan 1, 2007
127.728 bln
+16.858 bln
15.21%
jan 1, 2008
162.644 bln
+34.915 bln
27.34%
jan 1, 2009
215.837 bln
+53.194 bln
32.71%
jan 1, 2010
197.644 bln
-18.194 bln
-8.43%
jan 1, 2011
220.836 bln
+23.193 bln
11.73%
jan 1, 2012
272.293 bln
+51.457 bln
23.3%
jan 1, 2013
292.273 bln
+19.979 bln
7.34%
jan 1, 2014
315.48 bln
+23.207 bln
7.94%
jan 1, 2015
336.369 bln
+20.889 bln
6.62%
jan 1, 2016
295.359 bln
-41.009 bln
-12.19%
Ranking of countries by current statistics by years


Comments: