29
/
en
AIzaSyAYiBZKx7MnpbEhh9jyipgxe19OcubqV5w
April 1, 2024
40788
Late-demographic dividend
LTE
false
2
1
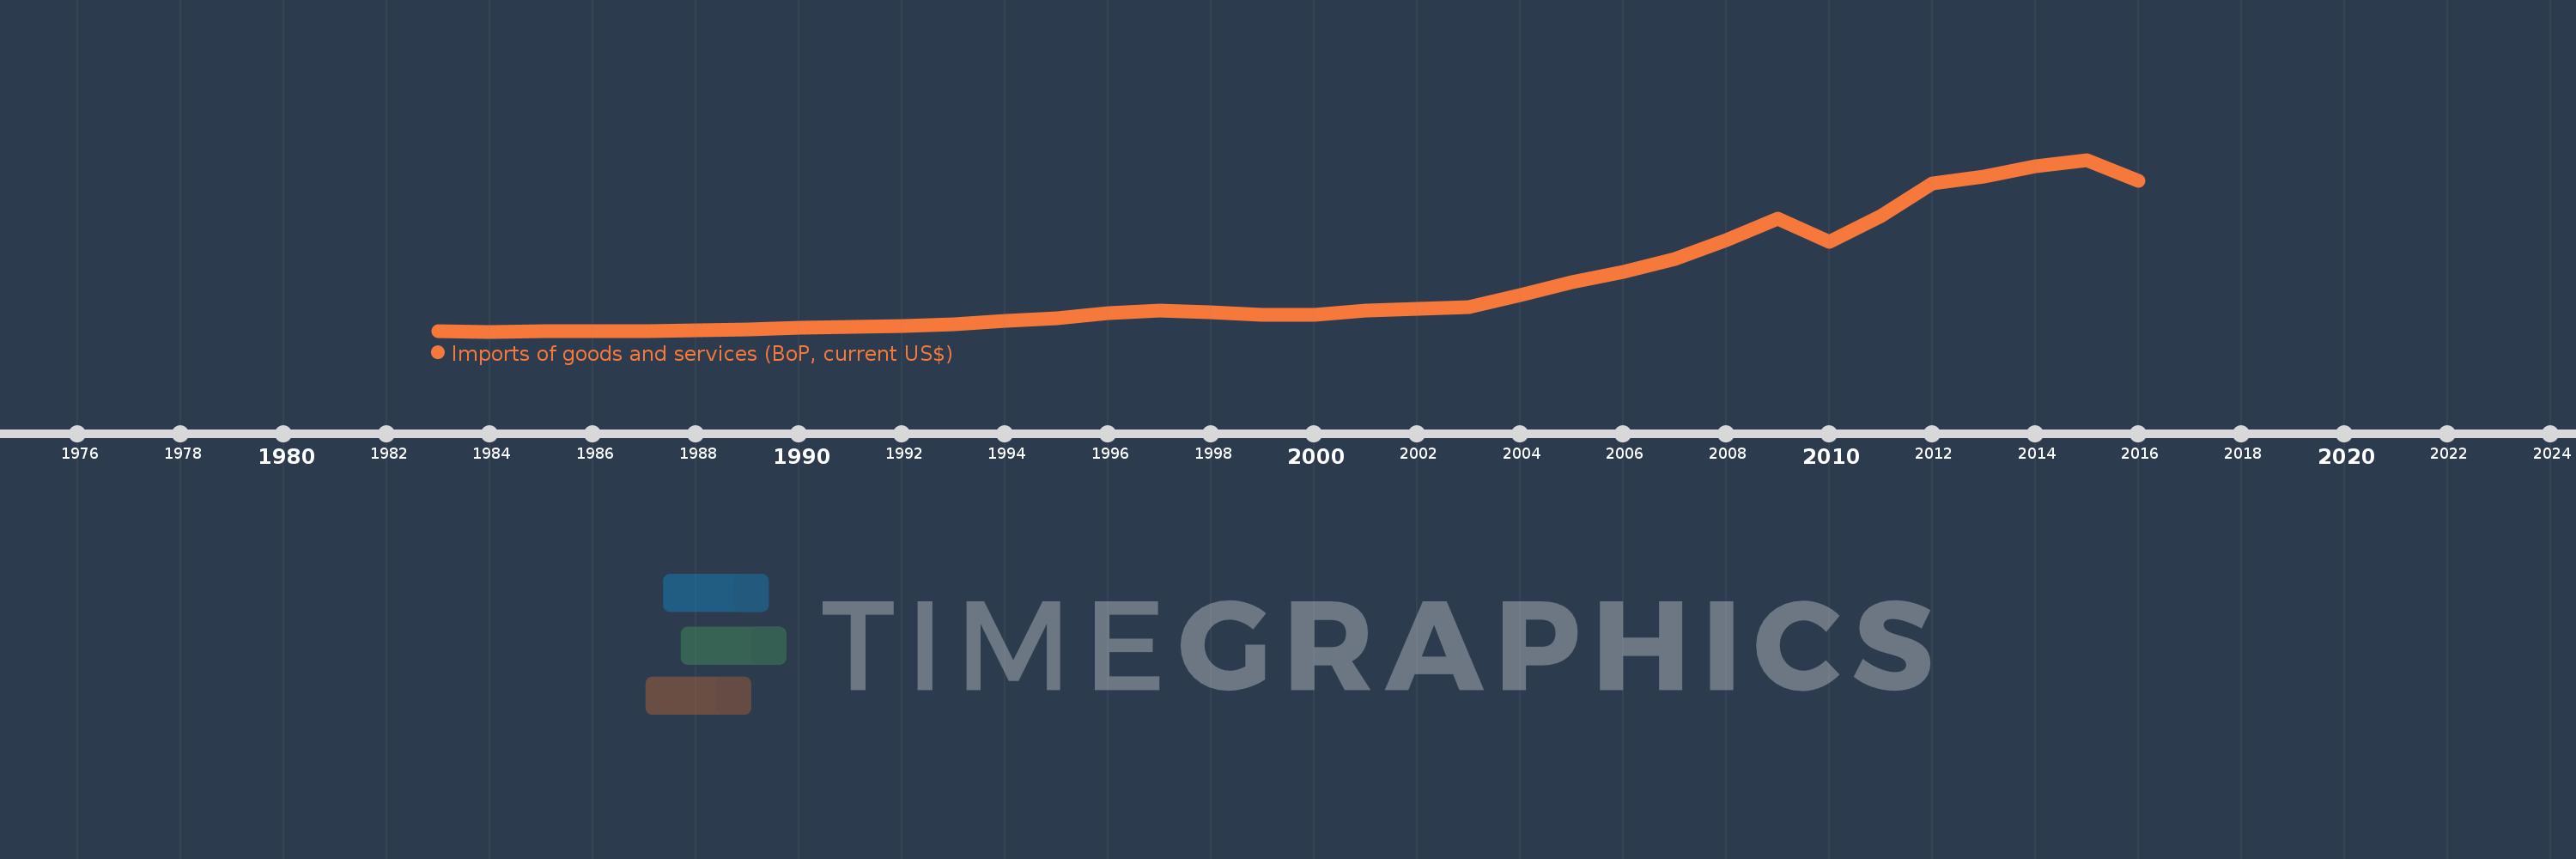
Imports of goods and services (BoP, current US$)
2016,2015,2014,2013,2012,2011,2010,2009,2008,2007,2006,2005,2004,2003,2002,2001,2000,1999,1998,1997,1996,1995,1994,1993,1992,1991,1990,1989,1988,1987,1986,1985,1984,1983
This statistics in other country:
AfghanistanAlbaniaAlgeriaAngolaAntigua and BarbudaArab WorldArgentinaArmeniaArubaAustraliaAustriaAzerbaijanBahamas, TheBahrainBangladeshBarbadosBelarusBelgiumBelizeBeninBermudaBhutanBoliviaBosnia and HerzegovinaBotswanaBrazilBrunei DarussalamBulgariaBurkina FasoBurundiCabo VerdeCambodiaCameroonCanadaCaribbean small statesCentral African RepublicCentral Europe and the BalticsChadChileChinaColombiaComorosCongo, Dem. Rep.Congo, Rep.Costa RicaCote d'IvoireCroatiaCuracaoCyprusCzech RepublicDenmarkDjiboutiDominicaDominican RepublicEarly-demographic dividendEast Asia & PacificEast Asia & Pacific (excluding high income)East Asia & Pacific (IDA & IBRD countries)EcuadorEgypt, Arab Rep.El SalvadorEquatorial GuineaEritreaEstoniaEthiopiaEuro areaEurope & Central AsiaEurope & Central Asia (excluding high income)Europe & Central Asia (IDA & IBRD countries)European UnionFaroe IslandsFijiFinlandFragile and conflict affected situationsFranceFrench PolynesiaGabonGambia, TheGeorgiaGermanyGhanaGreeceGrenadaGuatemalaGuineaGuinea-BissauGuyanaHaitiHeavily indebted poor countries (HIPC)High incomeHondurasHong Kong SAR, ChinaHungaryIBRD onlyIcelandIDA & IBRD totalIDA blendIDA onlyIDA totalIndiaIndonesiaIran, Islamic Rep.IraqIrelandIsraelItalyJamaicaJapanJordanKazakhstanKenyaKiribatiKorea, Rep.KosovoKuwaitKyrgyz RepublicLao PDRLate-demographic dividendLatin America & Caribbean Latin America & Caribbean (excluding high income)Latin America & the Caribbean (IDA & IBRD countries)LatviaLeast developed countries: UN classificationLebanonLesothoLiberiaLibyaLithuaniaLow & middle incomeLow incomeLower middle incomeLuxembourgMacao SAR, ChinaMacedonia, FYRMadagascarMalawiMalaysiaMaldivesMaliMaltaMarshall IslandsMauritaniaMauritiusMexicoMicronesia, Fed. Sts.Middle East & North Africa (excluding high income)Middle East & North Africa (IDA & IBRD countries)Middle incomeMoldovaMongoliaMontenegroMoroccoMozambiqueMyanmarNamibiaNepalNetherlandsNew CaledoniaNicaraguaNigerNigeriaNorth AmericaNorwayOECD membersOmanOther small statesPacific island small statesPakistanPalauPanamaPapua New GuineaParaguayPeruPhilippinesPolandPortugalPost-demographic dividendPre-demographic dividendQatarRomaniaRussian FederationRwandaSamoaSao Tome and PrincipeSaudi ArabiaSenegalSerbiaSeychellesSierra LeoneSingaporeSint Maarten (Dutch part)Slovak RepublicSloveniaSmall statesSolomon IslandsSouth AfricaSouth AsiaSouth Asia (IDA & IBRD)South SudanSpainSri LankaSt. Kitts and NevisSt. LuciaSt. Vincent and the GrenadinesSub-Saharan Africa Sub-Saharan Africa (excluding high income)Sub-Saharan Africa (IDA & IBRD countries)SudanSurinameSwazilandSwedenSwitzerlandSyrian Arab RepublicTajikistanTanzaniaThailandTimor-LesteTogoTongaTrinidad and TobagoTunisiaTurkeyTuvaluUgandaUkraineUnited KingdomUnited StatesUpper middle incomeUruguayVanuatuVenezuela, RBVietnamWest Bank and GazaWorldYemen, Rep.ZambiaZimbabwe Timeline:
This timeline shows a graph from 1983 to 2016 of Late-demographic dividend. No data until 1982. Number of actual observations by date: 34.
Source name:
World Development Indicators
Source organization:
International Monetary Fund, Balance of Payments Statistics Yearbook and data files.
Categories, topics:
Economy & Growth, Trade
Last updated:
apr 23, 2017
Indicators value changes by year
Minimum:
207.876 bln
jan 1, 1984
Maximum:
5.417 trl
jan 1, 2015
At the date of observation
Value
Absolute change
Change from previous value
jan 1, 1983
215.971 bln
+215.971 bln
0.0%
jan 1, 1984
207.876 bln
-8.095 bln
-3.75%
jan 1, 1985
214.925 bln
+7.049 bln
3.39%
jan 1, 1986
224.467 bln
+9.542 bln
4.44%
jan 1, 1987
220.649 bln
-3.818 bln
-1.7%
jan 1, 1988
238.029 bln
+17.38 bln
7.88%
jan 1, 1989
283.031 bln
+45.002 bln
18.91%
jan 1, 1990
321.119 bln
+38.088 bln
13.46%
jan 1, 1991
344.799 bln
+23.68 bln
7.37%
jan 1, 1992
383.338 bln
+38.539 bln
11.18%
jan 1, 1993
441.135 bln
+57.796 bln
15.08%
jan 1, 1994
522.798 bln
+81.664 bln
18.51%
jan 1, 1995
605.066 bln
+82.268 bln
15.74%
jan 1, 1996
771.797 bln
+166.73 bln
27.56%
jan 1, 1997
836.351 bln
+64.554 bln
8.36%
jan 1, 1998
792.32 bln
-44.031 bln
-5.26%
jan 1, 1999
723.816 bln
-68.504 bln
-8.65%
jan 1, 2000
706.948 bln
-16.868 bln
-2.33%
jan 1, 2001
847.391 bln
+140.444 bln
19.87%
jan 1, 2002
888.061 bln
+40.67 bln
4.8%
jan 1, 2003
952.634 bln
+64.573 bln
7.27%
jan 1, 2004
1.302 trl
+349.763 bln
36.72%
jan 1, 2005
1.699 trl
+396.906 bln
30.48%
jan 1, 2006
2.006 trl
+306.725 bln
18.05%
jan 1, 2007
2.399 trl
+393.061 bln
19.59%
jan 1, 2008
2.975 trl
+575.671 bln
24.0%
jan 1, 2009
3.635 trl
+659.818 bln
22.18%
jan 1, 2010
2.94 trl
-695.06 bln
-19.12%
jan 1, 2011
3.709 trl
+769.711 bln
26.18%
jan 1, 2012
4.688 trl
+978.85 bln
26.39%
jan 1, 2013
4.907 trl
+218.968 bln
4.67%
jan 1, 2014
5.232 trl
+324.83 bln
6.62%
jan 1, 2015
5.417 trl
+185.06 bln
3.54%
jan 1, 2016
4.781 trl
-635.933 bln
-11.74%
Ranking of countries by current statistics by years


Comments: