29
/
en
AIzaSyAYiBZKx7MnpbEhh9jyipgxe19OcubqV5w
April 1, 2024
24185
Arab World
ARB
false
2
1
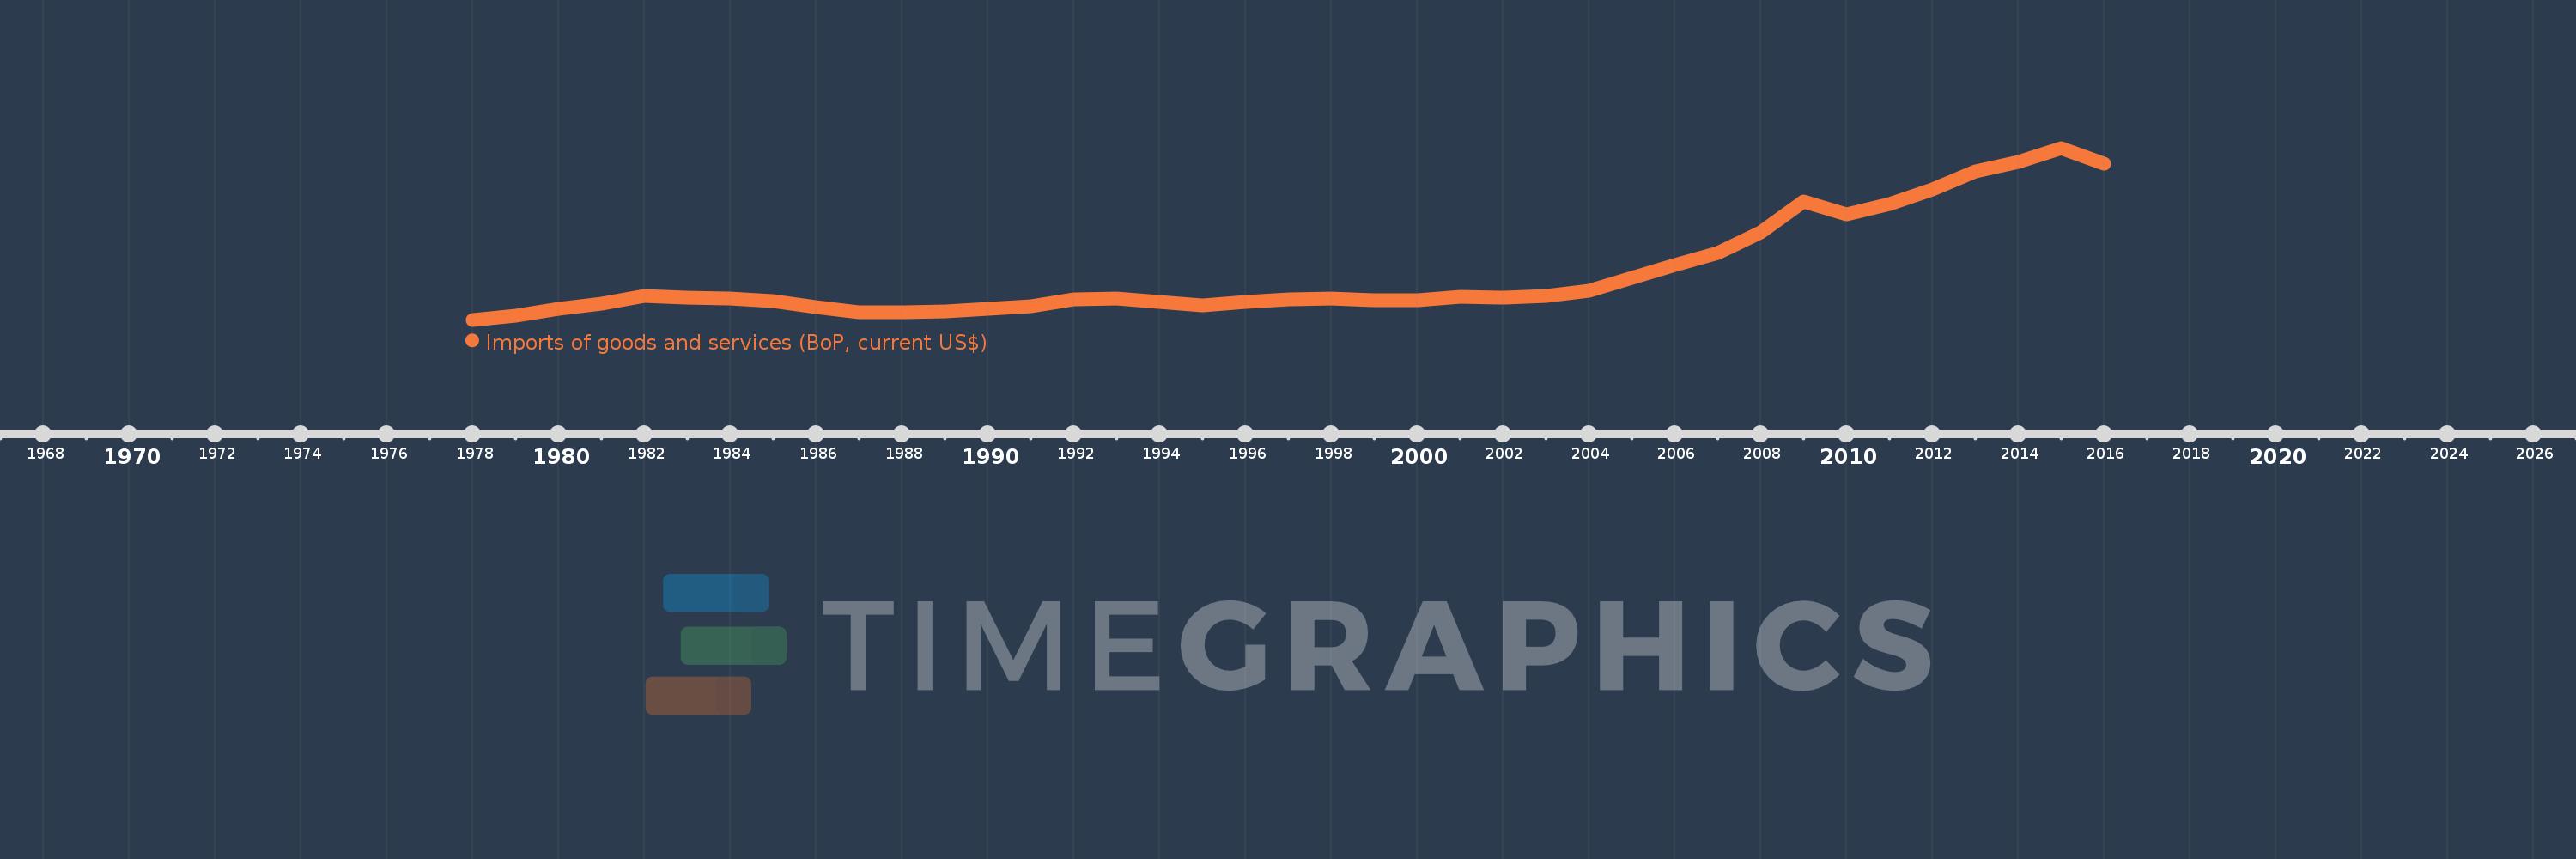
Imports of goods and services (BoP, current US$)
2016,2015,2014,2013,2012,2011,2010,2009,2008,2007,2006,2005,2004,2003,2002,2001,2000,1999,1998,1997,1996,1995,1994,1993,1992,1991,1990,1989,1988,1987,1986,1985,1984,1983,1982,1981,1980,1979,1978
This statistics in other country:
AfghanistanAlbaniaAlgeriaAngolaAntigua and BarbudaArab WorldArgentinaArmeniaArubaAustraliaAustriaAzerbaijanBahamas, TheBahrainBangladeshBarbadosBelarusBelgiumBelizeBeninBermudaBhutanBoliviaBosnia and HerzegovinaBotswanaBrazilBrunei DarussalamBulgariaBurkina FasoBurundiCabo VerdeCambodiaCameroonCanadaCaribbean small statesCentral African RepublicCentral Europe and the BalticsChadChileChinaColombiaComorosCongo, Dem. Rep.Congo, Rep.Costa RicaCote d'IvoireCroatiaCuracaoCyprusCzech RepublicDenmarkDjiboutiDominicaDominican RepublicEarly-demographic dividendEast Asia & PacificEast Asia & Pacific (excluding high income)East Asia & Pacific (IDA & IBRD countries)EcuadorEgypt, Arab Rep.El SalvadorEquatorial GuineaEritreaEstoniaEthiopiaEuro areaEurope & Central AsiaEurope & Central Asia (excluding high income)Europe & Central Asia (IDA & IBRD countries)European UnionFaroe IslandsFijiFinlandFragile and conflict affected situationsFranceFrench PolynesiaGabonGambia, TheGeorgiaGermanyGhanaGreeceGrenadaGuatemalaGuineaGuinea-BissauGuyanaHaitiHeavily indebted poor countries (HIPC)High incomeHondurasHong Kong SAR, ChinaHungaryIBRD onlyIcelandIDA & IBRD totalIDA blendIDA onlyIDA totalIndiaIndonesiaIran, Islamic Rep.IraqIrelandIsraelItalyJamaicaJapanJordanKazakhstanKenyaKiribatiKorea, Rep.KosovoKuwaitKyrgyz RepublicLao PDRLate-demographic dividendLatin America & Caribbean Latin America & Caribbean (excluding high income)Latin America & the Caribbean (IDA & IBRD countries)LatviaLeast developed countries: UN classificationLebanonLesothoLiberiaLibyaLithuaniaLow & middle incomeLow incomeLower middle incomeLuxembourgMacao SAR, ChinaMacedonia, FYRMadagascarMalawiMalaysiaMaldivesMaliMaltaMarshall IslandsMauritaniaMauritiusMexicoMicronesia, Fed. Sts.Middle East & North Africa (excluding high income)Middle East & North Africa (IDA & IBRD countries)Middle incomeMoldovaMongoliaMontenegroMoroccoMozambiqueMyanmarNamibiaNepalNetherlandsNew CaledoniaNicaraguaNigerNigeriaNorth AmericaNorwayOECD membersOmanOther small statesPacific island small statesPakistanPalauPanamaPapua New GuineaParaguayPeruPhilippinesPolandPortugalPost-demographic dividendPre-demographic dividendQatarRomaniaRussian FederationRwandaSamoaSao Tome and PrincipeSaudi ArabiaSenegalSerbiaSeychellesSierra LeoneSingaporeSint Maarten (Dutch part)Slovak RepublicSloveniaSmall statesSolomon IslandsSouth AfricaSouth AsiaSouth Asia (IDA & IBRD)South SudanSpainSri LankaSt. Kitts and NevisSt. LuciaSt. Vincent and the GrenadinesSub-Saharan Africa Sub-Saharan Africa (excluding high income)Sub-Saharan Africa (IDA & IBRD countries)SudanSurinameSwazilandSwedenSwitzerlandSyrian Arab RepublicTajikistanTanzaniaThailandTimor-LesteTogoTongaTrinidad and TobagoTunisiaTurkeyTuvaluUgandaUkraineUnited KingdomUnited StatesUpper middle incomeUruguayVanuatuVenezuela, RBVietnamWest Bank and GazaWorldYemen, Rep.ZambiaZimbabwe Timeline:
This timeline shows a graph from 1978 to 2016 of Arab World. No data until 1977. Number of actual observations by date: 39.
Source name:
World Development Indicators
Source organization:
International Monetary Fund, Balance of Payments Statistics Yearbook and data files.
Categories, topics:
Economy & Growth, Trade
Last updated:
apr 23, 2017
Indicators value changes by year
Minimum:
116.006 bln
jan 1, 1978
Maximum:
1.197 trl
jan 1, 2015
At the date of observation
Value
Absolute change
Change from previous value
jan 1, 1978
116.006 bln
+116.006 bln
0.0%
jan 1, 1979
139.656 bln
+23.65 bln
20.39%
jan 1, 1980
182.726 bln
+43.07 bln
30.84%
jan 1, 1981
219.579 bln
+36.853 bln
20.17%
jan 1, 1982
263.009 bln
+43.43 bln
19.78%
jan 1, 1983
253.376 bln
-9.634 bln
-3.66%
jan 1, 1984
247.247 bln
-6.128 bln
-2.42%
jan 1, 1985
233.467 bln
-13.78 bln
-5.57%
jan 1, 1986
197.777 bln
-35.69 bln
-15.29%
jan 1, 1987
165.18 bln
-32.597 bln
-16.48%
jan 1, 1988
165.587 bln
+407.088 mln
0.25%
jan 1, 1989
170.119 bln
+4.532 bln
2.74%
jan 1, 1990
184.143 bln
+14.024 bln
8.24%
jan 1, 1991
200.425 bln
+16.283 bln
8.84%
jan 1, 1992
243.043 bln
+42.617 bln
21.26%
jan 1, 1993
247.073 bln
+4.03 bln
1.66%
jan 1, 1994
227.933 bln
-19.139 bln
-7.75%
jan 1, 1995
208.334 bln
-19.6 bln
-8.6%
jan 1, 1996
226.01 bln
+17.677 bln
8.48%
jan 1, 1997
243.337 bln
+17.326 bln
7.67%
jan 1, 1998
251.447 bln
+8.11 bln
3.33%
jan 1, 1999
238.704 bln
-12.743 bln
-5.07%
jan 1, 2000
236.065 bln
-2.639 bln
-1.11%
jan 1, 2001
257.971 bln
+21.907 bln
9.28%
jan 1, 2002
252.237 bln
-5.734 bln
-2.22%
jan 1, 2003
267.525 bln
+15.288 bln
6.06%
jan 1, 2004
298.798 bln
+31.273 bln
11.69%
jan 1, 2005
378.414 bln
+79.616 bln
26.65%
jan 1, 2006
461.312 bln
+82.898 bln
21.91%
jan 1, 2007
536.047 bln
+74.735 bln
16.2%
jan 1, 2008
667.822 bln
+131.775 bln
24.58%
jan 1, 2009
858.685 bln
+190.863 bln
28.58%
jan 1, 2010
777.069 bln
-81.616 bln
-9.5%
jan 1, 2011
843.31 bln
+66.241 bln
8.52%
jan 1, 2012
933.66 bln
+90.35 bln
10.71%
jan 1, 2013
1.048 trl
+114.673 bln
12.28%
jan 1, 2014
1.111 trl
+62.601 bln
5.97%
jan 1, 2015
1.197 trl
+85.625 bln
7.71%
jan 1, 2016
1.099 trl
-97.377 bln
-8.14%
Ranking of countries by current statistics by years


Comments: