29
/
en
AIzaSyAYiBZKx7MnpbEhh9jyipgxe19OcubqV5w
April 1, 2024
37441
IDA & IBRD total
IBT
false
2
1
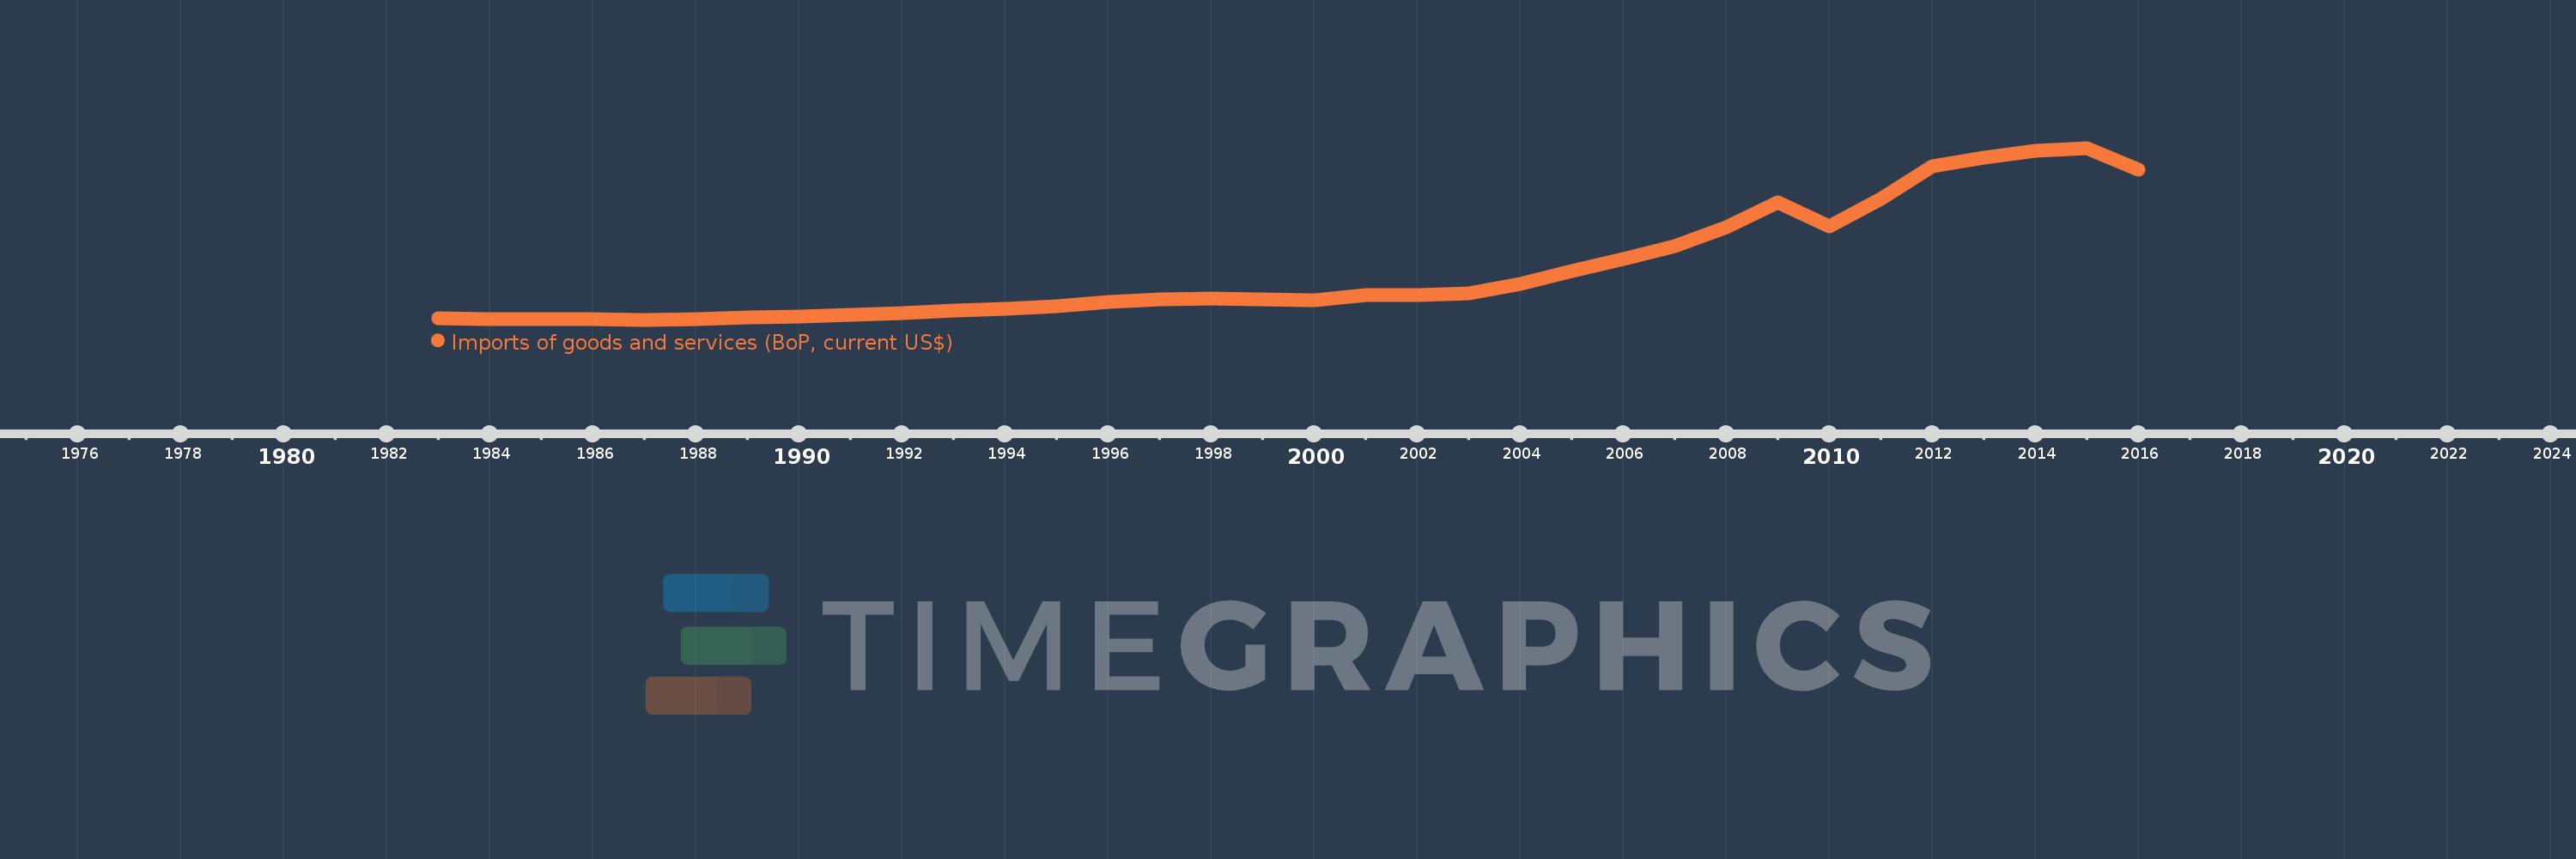
Imports of goods and services (BoP, current US$)
2016,2015,2014,2013,2012,2011,2010,2009,2008,2007,2006,2005,2004,2003,2002,2001,2000,1999,1998,1997,1996,1995,1994,1993,1992,1991,1990,1989,1988,1987,1986,1985,1984,1983
This statistics in other country:
AfghanistanAlbaniaAlgeriaAngolaAntigua and BarbudaArab WorldArgentinaArmeniaArubaAustraliaAustriaAzerbaijanBahamas, TheBahrainBangladeshBarbadosBelarusBelgiumBelizeBeninBermudaBhutanBoliviaBosnia and HerzegovinaBotswanaBrazilBrunei DarussalamBulgariaBurkina FasoBurundiCabo VerdeCambodiaCameroonCanadaCaribbean small statesCentral African RepublicCentral Europe and the BalticsChadChileChinaColombiaComorosCongo, Dem. Rep.Congo, Rep.Costa RicaCote d'IvoireCroatiaCuracaoCyprusCzech RepublicDenmarkDjiboutiDominicaDominican RepublicEarly-demographic dividendEast Asia & PacificEast Asia & Pacific (excluding high income)East Asia & Pacific (IDA & IBRD countries)EcuadorEgypt, Arab Rep.El SalvadorEquatorial GuineaEritreaEstoniaEthiopiaEuro areaEurope & Central AsiaEurope & Central Asia (excluding high income)Europe & Central Asia (IDA & IBRD countries)European UnionFaroe IslandsFijiFinlandFragile and conflict affected situationsFranceFrench PolynesiaGabonGambia, TheGeorgiaGermanyGhanaGreeceGrenadaGuatemalaGuineaGuinea-BissauGuyanaHaitiHeavily indebted poor countries (HIPC)High incomeHondurasHong Kong SAR, ChinaHungaryIBRD onlyIcelandIDA & IBRD totalIDA blendIDA onlyIDA totalIndiaIndonesiaIran, Islamic Rep.IraqIrelandIsraelItalyJamaicaJapanJordanKazakhstanKenyaKiribatiKorea, Rep.KosovoKuwaitKyrgyz RepublicLao PDRLate-demographic dividendLatin America & Caribbean Latin America & Caribbean (excluding high income)Latin America & the Caribbean (IDA & IBRD countries)LatviaLeast developed countries: UN classificationLebanonLesothoLiberiaLibyaLithuaniaLow & middle incomeLow incomeLower middle incomeLuxembourgMacao SAR, ChinaMacedonia, FYRMadagascarMalawiMalaysiaMaldivesMaliMaltaMarshall IslandsMauritaniaMauritiusMexicoMicronesia, Fed. Sts.Middle East & North Africa (excluding high income)Middle East & North Africa (IDA & IBRD countries)Middle incomeMoldovaMongoliaMontenegroMoroccoMozambiqueMyanmarNamibiaNepalNetherlandsNew CaledoniaNicaraguaNigerNigeriaNorth AmericaNorwayOECD membersOmanOther small statesPacific island small statesPakistanPalauPanamaPapua New GuineaParaguayPeruPhilippinesPolandPortugalPost-demographic dividendPre-demographic dividendQatarRomaniaRussian FederationRwandaSamoaSao Tome and PrincipeSaudi ArabiaSenegalSerbiaSeychellesSierra LeoneSingaporeSint Maarten (Dutch part)Slovak RepublicSloveniaSmall statesSolomon IslandsSouth AfricaSouth AsiaSouth Asia (IDA & IBRD)South SudanSpainSri LankaSt. Kitts and NevisSt. LuciaSt. Vincent and the GrenadinesSub-Saharan Africa Sub-Saharan Africa (excluding high income)Sub-Saharan Africa (IDA & IBRD countries)SudanSurinameSwazilandSwedenSwitzerlandSyrian Arab RepublicTajikistanTanzaniaThailandTimor-LesteTogoTongaTrinidad and TobagoTunisiaTurkeyTuvaluUgandaUkraineUnited KingdomUnited StatesUpper middle incomeUruguayVanuatuVenezuela, RBVietnamWest Bank and GazaWorldYemen, Rep.ZambiaZimbabwe Timeline:
This timeline shows a graph from 1983 to 2016 of IDA & IBRD total. No data until 1982. Number of actual observations by date: 34.
Source name:
World Development Indicators
Source organization:
International Monetary Fund, Balance of Payments Statistics Yearbook and data files.
Categories, topics:
Economy & Growth, Trade
Last updated:
apr 23, 2017
Indicators value changes by year
Minimum:
413.872 bln
jan 1, 1987
Maximum:
7.689 trl
jan 1, 2015
At the date of observation
Value
Absolute change
Change from previous value
jan 1, 1983
472.814 bln
+472.814 bln
0.0%
jan 1, 1984
436.222 bln
-36.591 bln
-7.74%
jan 1, 1985
438.147 bln
+1.925 bln
0.44%
jan 1, 1986
431.891 bln
-6.256 bln
-1.43%
jan 1, 1987
413.872 bln
-18.019 bln
-4.17%
jan 1, 1988
454.854 bln
+40.982 bln
9.9%
jan 1, 1989
515.916 bln
+61.062 bln
13.42%
jan 1, 1990
565.843 bln
+49.926 bln
9.68%
jan 1, 1991
638.965 bln
+73.122 bln
12.92%
jan 1, 1992
695.901 bln
+56.935 bln
8.91%
jan 1, 1993
787.436 bln
+91.536 bln
13.15%
jan 1, 1994
882.045 bln
+94.609 bln
12.01%
jan 1, 1995
980.414 bln
+98.369 bln
11.15%
jan 1, 1996
1.181 trl
+200.73 bln
20.47%
jan 1, 1997
1.291 trl
+110.16 bln
9.33%
jan 1, 1998
1.32 trl
+29.142 bln
2.26%
jan 1, 1999
1.28 trl
-40.422 bln
-3.06%
jan 1, 2000
1.253 trl
-27.018 bln
-2.11%
jan 1, 2001
1.469 trl
+215.624 bln
17.21%
jan 1, 2002
1.473 trl
+4.772 bln
0.32%
jan 1, 2003
1.54 trl
+66.764 bln
4.53%
jan 1, 2004
1.943 trl
+403.227 bln
26.18%
jan 1, 2005
2.481 trl
+537.271 bln
27.65%
jan 1, 2006
2.977 trl
+495.967 bln
19.99%
jan 1, 2007
3.529 trl
+552.745 bln
18.57%
jan 1, 2008
4.334 trl
+804.244 bln
22.79%
jan 1, 2009
5.391 trl
+1.057 trl
24.4%
jan 1, 2010
4.357 trl
-1.034 trl
-19.19%
jan 1, 2011
5.526 trl
+1.17 trl
26.85%
jan 1, 2012
6.898 trl
+1.371 trl
24.81%
jan 1, 2013
7.265 trl
+367.783 bln
5.33%
jan 1, 2014
7.583 trl
+317.168 bln
4.37%
jan 1, 2015
7.689 trl
+106.886 bln
1.41%
jan 1, 2016
6.757 trl
-932.665 bln
-12.13%
Ranking of countries by current statistics by years


Comments: