29
/
en
AIzaSyAYiBZKx7MnpbEhh9jyipgxe19OcubqV5w
April 1, 2024
269455
Turkey
TUR
true
2
1
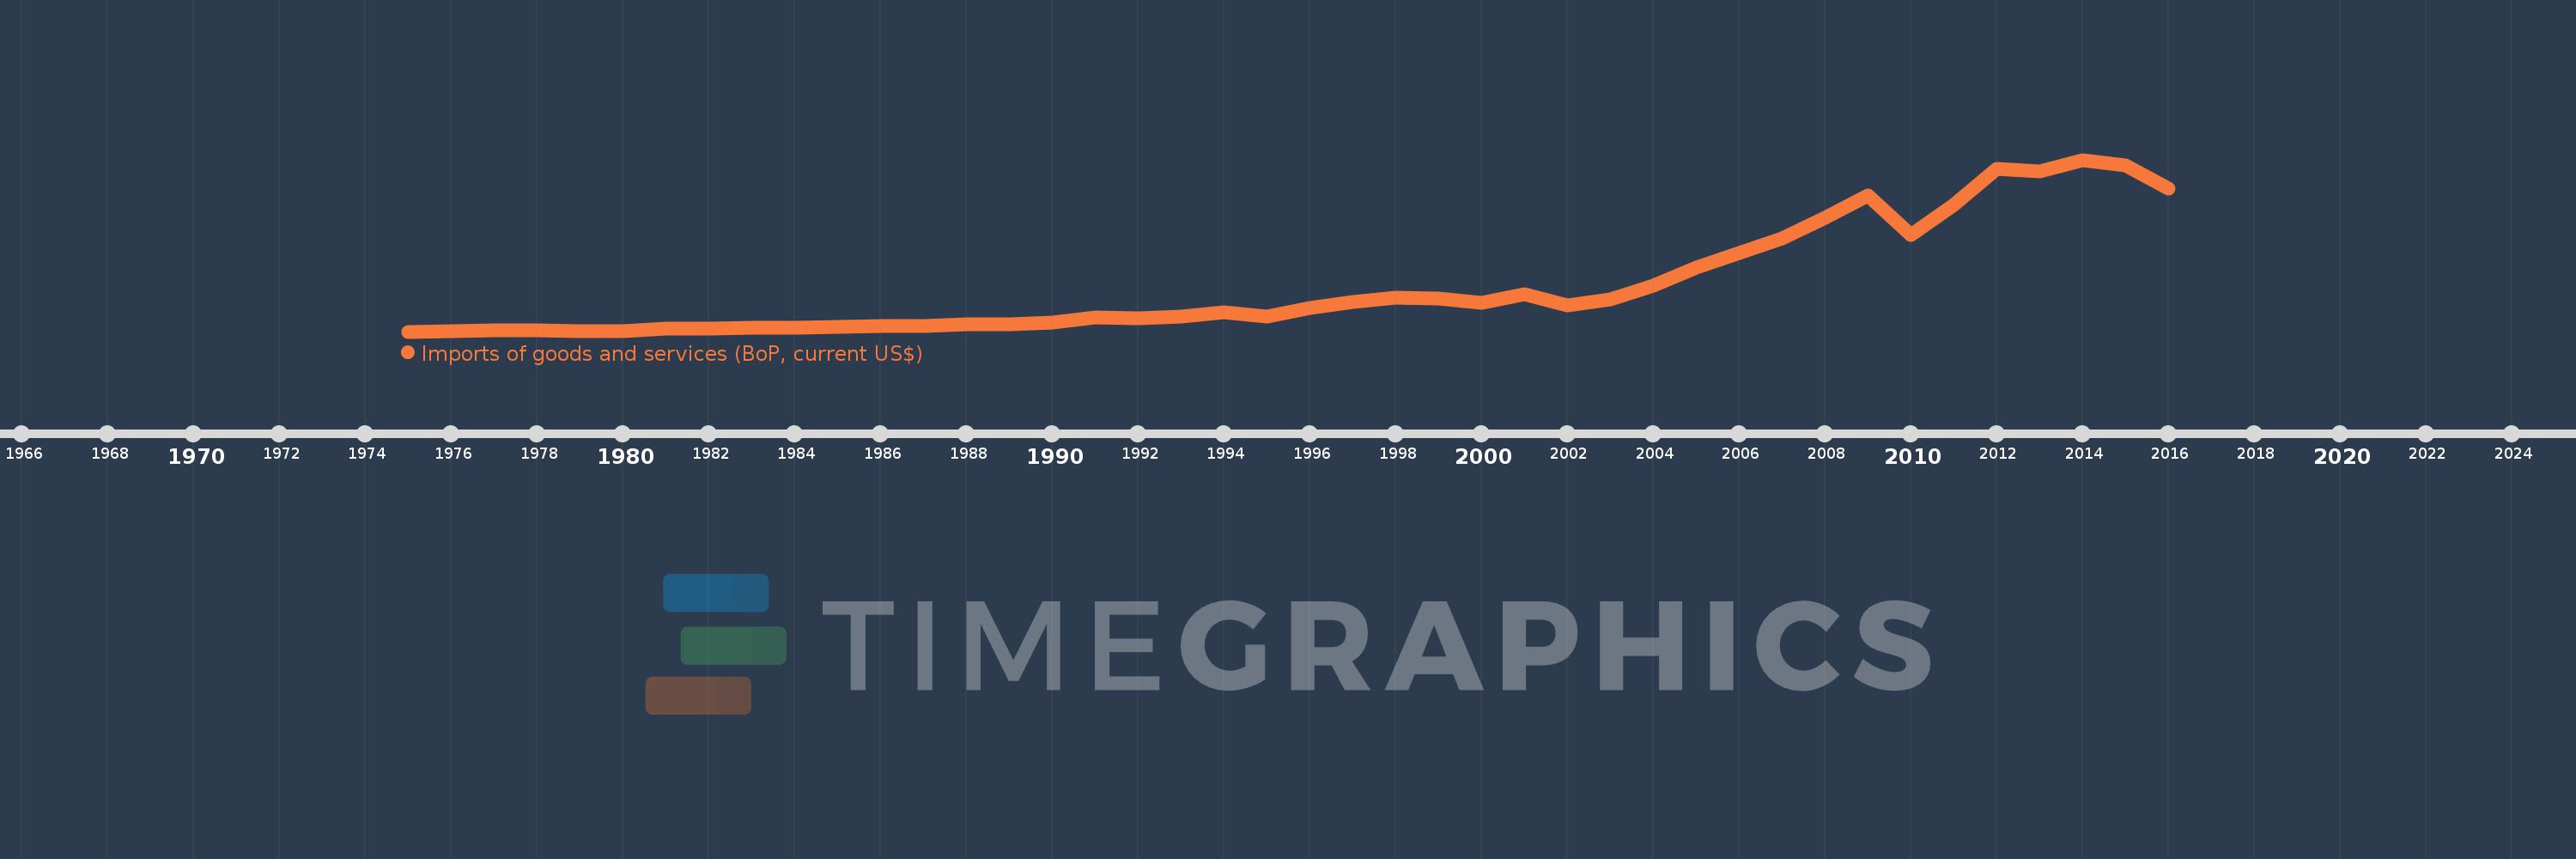
Imports of goods and services (BoP, current US$)
2016,2015,2014,2013,2012,2011,2010,2009,2008,2007,2006,2005,2004,2003,2002,2001,2000,1999,1998,1997,1996,1995,1994,1993,1992,1991,1990,1989,1988,1987,1986,1985,1984,1983,1982,1981,1980,1979,1978,1977,1976,1975
This statistics in other country:
AfghanistanAlbaniaAlgeriaAngolaAntigua and BarbudaArab WorldArgentinaArmeniaArubaAustraliaAustriaAzerbaijanBahamas, TheBahrainBangladeshBarbadosBelarusBelgiumBelizeBeninBermudaBhutanBoliviaBosnia and HerzegovinaBotswanaBrazilBrunei DarussalamBulgariaBurkina FasoBurundiCabo VerdeCambodiaCameroonCanadaCaribbean small statesCentral African RepublicCentral Europe and the BalticsChadChileChinaColombiaComorosCongo, Dem. Rep.Congo, Rep.Costa RicaCote d'IvoireCroatiaCuracaoCyprusCzech RepublicDenmarkDjiboutiDominicaDominican RepublicEarly-demographic dividendEast Asia & PacificEast Asia & Pacific (excluding high income)East Asia & Pacific (IDA & IBRD countries)EcuadorEgypt, Arab Rep.El SalvadorEquatorial GuineaEritreaEstoniaEthiopiaEuro areaEurope & Central AsiaEurope & Central Asia (excluding high income)Europe & Central Asia (IDA & IBRD countries)European UnionFaroe IslandsFijiFinlandFragile and conflict affected situationsFranceFrench PolynesiaGabonGambia, TheGeorgiaGermanyGhanaGreeceGrenadaGuatemalaGuineaGuinea-BissauGuyanaHaitiHeavily indebted poor countries (HIPC)High incomeHondurasHong Kong SAR, ChinaHungaryIBRD onlyIcelandIDA & IBRD totalIDA blendIDA onlyIDA totalIndiaIndonesiaIran, Islamic Rep.IraqIrelandIsraelItalyJamaicaJapanJordanKazakhstanKenyaKiribatiKorea, Rep.KosovoKuwaitKyrgyz RepublicLao PDRLate-demographic dividendLatin America & Caribbean Latin America & Caribbean (excluding high income)Latin America & the Caribbean (IDA & IBRD countries)LatviaLeast developed countries: UN classificationLebanonLesothoLiberiaLibyaLithuaniaLow & middle incomeLow incomeLower middle incomeLuxembourgMacao SAR, ChinaMacedonia, FYRMadagascarMalawiMalaysiaMaldivesMaliMaltaMarshall IslandsMauritaniaMauritiusMexicoMicronesia, Fed. Sts.Middle East & North Africa (excluding high income)Middle East & North Africa (IDA & IBRD countries)Middle incomeMoldovaMongoliaMontenegroMoroccoMozambiqueMyanmarNamibiaNepalNetherlandsNew CaledoniaNicaraguaNigerNigeriaNorth AmericaNorwayOECD membersOmanOther small statesPacific island small statesPakistanPalauPanamaPapua New GuineaParaguayPeruPhilippinesPolandPortugalPost-demographic dividendPre-demographic dividendQatarRomaniaRussian FederationRwandaSamoaSao Tome and PrincipeSaudi ArabiaSenegalSerbiaSeychellesSierra LeoneSingaporeSint Maarten (Dutch part)Slovak RepublicSloveniaSmall statesSolomon IslandsSouth AfricaSouth AsiaSouth Asia (IDA & IBRD)South SudanSpainSri LankaSt. Kitts and NevisSt. LuciaSt. Vincent and the GrenadinesSub-Saharan Africa Sub-Saharan Africa (excluding high income)Sub-Saharan Africa (IDA & IBRD countries)SudanSurinameSwazilandSwedenSwitzerlandSyrian Arab RepublicTajikistanTanzaniaThailandTimor-LesteTogoTongaTrinidad and TobagoTunisiaTurkeyTuvaluUgandaUkraineUnited KingdomUnited StatesUpper middle incomeUruguayVanuatuVenezuela, RBVietnamWest Bank and GazaWorldYemen, Rep.ZambiaZimbabwe Timeline:
This timeline shows a graph from 1975 to 2016 of Turkey. No data until 1974. Number of actual observations by date: 42.
Source name:
World Development Indicators
Source organization:
International Monetary Fund, Balance of Payments Statistics Yearbook and data files.
Categories, topics:
Economy & Growth, Trade
Last updated:
apr 23, 2017
Indicators value changes by year
Minimum:
3.955 bln
jan 1, 1975
Maximum:
266.224 bln
jan 1, 2014
At the date of observation
Value
Absolute change
Change from previous value
jan 1, 1975
3.955 bln
+3.955 bln
0.0%
jan 1, 1976
4.938 bln
+983.0 mln
24.85%
jan 1, 1977
5.389 bln
+451.0 mln
9.13%
jan 1, 1978
6.193 bln
+804.0 mln
14.92%
jan 1, 1979
4.679 bln
-1.514 bln
-24.45%
jan 1, 1980
5.182 bln
+503.0 mln
10.75%
jan 1, 1981
8.082 bln
+2.9 bln
55.96%
jan 1, 1982
9.035 bln
+953.0 mln
11.79%
jan 1, 1983
9.549 bln
+514.0 mln
5.69%
jan 1, 1984
10.061 bln
+512.0 mln
5.36%
jan 1, 1985
11.533 bln
+1.472 bln
14.63%
jan 1, 1986
12.495 bln
+962.0 mln
8.34%
jan 1, 1987
12.008 bln
-487.0 mln
-3.9%
jan 1, 1988
15.179 bln
+3.171 bln
26.41%
jan 1, 1989
15.561 bln
+382.0 mln
2.52%
jan 1, 1990
18.356 bln
+2.795 bln
17.96%
jan 1, 1991
25.524 bln
+7.168 bln
39.05%
jan 1, 1992
24.165 bln
-1.359 bln
-5.32%
jan 1, 1993
26.567 bln
+2.402 bln
9.94%
jan 1, 1994
33.603 bln
+7.036 bln
26.48%
jan 1, 1995
26.306 bln
-7.297 bln
-21.72%
jan 1, 1996
40.113 bln
+13.807 bln
52.49%
jan 1, 1997
48.757 bln
+8.644 bln
21.55%
jan 1, 1998
55.664 bln
+6.907 bln
14.17%
jan 1, 1999
54.637 bln
-1.027 bln
-1.84%
jan 1, 2000
47.751 bln
-6.886 bln
-12.6%
jan 1, 2001
61.035 bln
+13.284 bln
27.82%
jan 1, 2002
44.19 bln
-16.845 bln
-27.6%
jan 1, 2003
53.255 bln
+9.065 bln
20.51%
jan 1, 2004
73.519 bln
+20.264 bln
38.05%
jan 1, 2005
101.624 bln
+28.105 bln
38.23%
jan 1, 2006
123.395 bln
+21.771 bln
21.42%
jan 1, 2007
146.862 bln
+23.467 bln
19.02%
jan 1, 2008
178.125 bln
+31.263 bln
21.29%
jan 1, 2009
212.024 bln
+33.899 bln
19.03%
jan 1, 2010
151.581 bln
-60.443 bln
-28.51%
jan 1, 2011
197.021 bln
+45.44 bln
29.98%
jan 1, 2012
252.522 bln
+55.501 bln
28.17%
jan 1, 2013
248.294 bln
-4.228 bln
-1.67%
jan 1, 2014
266.224 bln
+17.93 bln
7.22%
jan 1, 2015
257.611 bln
-8.613 bln
-3.24%
jan 1, 2016
222.69 bln
-34.921 bln
-13.56%
Ranking of countries by current statistics by years


Comments: