29
/
en
AIzaSyAYiBZKx7MnpbEhh9jyipgxe19OcubqV5w
April 1, 2024
268111
Tunisia
TUN
true
2
1
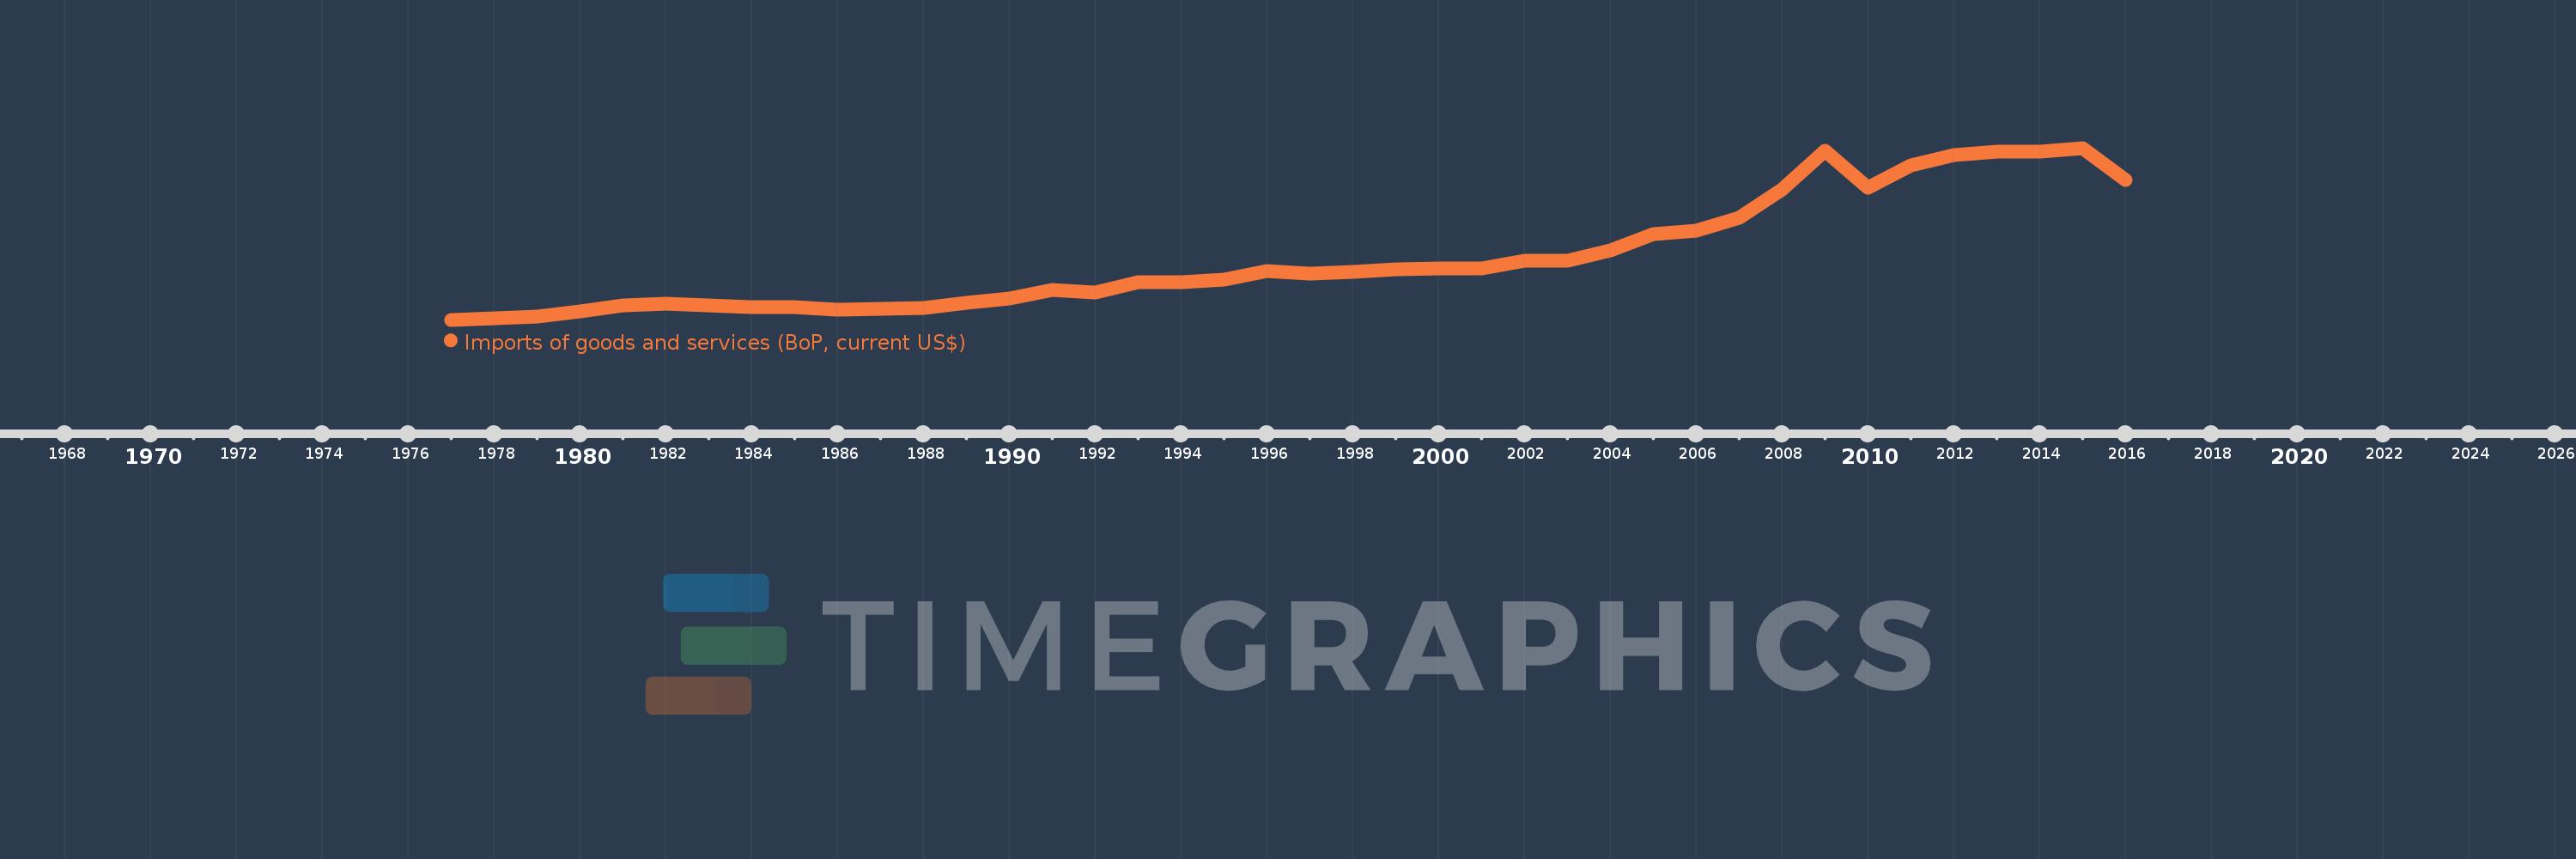
Imports of goods and services (BoP, current US$)
2016,2015,2014,2013,2012,2011,2010,2009,2008,2007,2006,2005,2004,2003,2002,2001,2000,1999,1998,1997,1996,1995,1994,1993,1992,1991,1990,1989,1988,1987,1986,1985,1984,1983,1982,1981,1980,1979,1978,1977
This statistics in other country:
AfghanistanAlbaniaAlgeriaAngolaAntigua and BarbudaArab WorldArgentinaArmeniaArubaAustraliaAustriaAzerbaijanBahamas, TheBahrainBangladeshBarbadosBelarusBelgiumBelizeBeninBermudaBhutanBoliviaBosnia and HerzegovinaBotswanaBrazilBrunei DarussalamBulgariaBurkina FasoBurundiCabo VerdeCambodiaCameroonCanadaCaribbean small statesCentral African RepublicCentral Europe and the BalticsChadChileChinaColombiaComorosCongo, Dem. Rep.Congo, Rep.Costa RicaCote d'IvoireCroatiaCuracaoCyprusCzech RepublicDenmarkDjiboutiDominicaDominican RepublicEarly-demographic dividendEast Asia & PacificEast Asia & Pacific (excluding high income)East Asia & Pacific (IDA & IBRD countries)EcuadorEgypt, Arab Rep.El SalvadorEquatorial GuineaEritreaEstoniaEthiopiaEuro areaEurope & Central AsiaEurope & Central Asia (excluding high income)Europe & Central Asia (IDA & IBRD countries)European UnionFaroe IslandsFijiFinlandFragile and conflict affected situationsFranceFrench PolynesiaGabonGambia, TheGeorgiaGermanyGhanaGreeceGrenadaGuatemalaGuineaGuinea-BissauGuyanaHaitiHeavily indebted poor countries (HIPC)High incomeHondurasHong Kong SAR, ChinaHungaryIBRD onlyIcelandIDA & IBRD totalIDA blendIDA onlyIDA totalIndiaIndonesiaIran, Islamic Rep.IraqIrelandIsraelItalyJamaicaJapanJordanKazakhstanKenyaKiribatiKorea, Rep.KosovoKuwaitKyrgyz RepublicLao PDRLate-demographic dividendLatin America & Caribbean Latin America & Caribbean (excluding high income)Latin America & the Caribbean (IDA & IBRD countries)LatviaLeast developed countries: UN classificationLebanonLesothoLiberiaLibyaLithuaniaLow & middle incomeLow incomeLower middle incomeLuxembourgMacao SAR, ChinaMacedonia, FYRMadagascarMalawiMalaysiaMaldivesMaliMaltaMarshall IslandsMauritaniaMauritiusMexicoMicronesia, Fed. Sts.Middle East & North Africa (excluding high income)Middle East & North Africa (IDA & IBRD countries)Middle incomeMoldovaMongoliaMontenegroMoroccoMozambiqueMyanmarNamibiaNepalNetherlandsNew CaledoniaNicaraguaNigerNigeriaNorth AmericaNorwayOECD membersOmanOther small statesPacific island small statesPakistanPalauPanamaPapua New GuineaParaguayPeruPhilippinesPolandPortugalPost-demographic dividendPre-demographic dividendQatarRomaniaRussian FederationRwandaSamoaSao Tome and PrincipeSaudi ArabiaSenegalSerbiaSeychellesSierra LeoneSingaporeSint Maarten (Dutch part)Slovak RepublicSloveniaSmall statesSolomon IslandsSouth AfricaSouth AsiaSouth Asia (IDA & IBRD)South SudanSpainSri LankaSt. Kitts and NevisSt. LuciaSt. Vincent and the GrenadinesSub-Saharan Africa Sub-Saharan Africa (excluding high income)Sub-Saharan Africa (IDA & IBRD countries)SudanSurinameSwazilandSwedenSwitzerlandSyrian Arab RepublicTajikistanTanzaniaThailandTimor-LesteTogoTongaTrinidad and TobagoTunisiaTurkeyTuvaluUgandaUkraineUnited KingdomUnited StatesUpper middle incomeUruguayVanuatuVenezuela, RBVietnamWest Bank and GazaWorldYemen, Rep.ZambiaZimbabwe Timeline:
This timeline shows a graph from 1977 to 2016 of Tunisia. No data until 1976. Number of actual observations by date: 40.
Source name:
World Development Indicators
Source organization:
International Monetary Fund, Balance of Payments Statistics Yearbook and data files.
Categories, topics:
Economy & Growth, Trade
Last updated:
apr 23, 2017
Indicators value changes by year
Minimum:
1.731 bln
jan 1, 1977
Maximum:
26.803 bln
jan 1, 2015
At the date of observation
Value
Absolute change
Change from previous value
jan 1, 1977
1.731 bln
+1.731 bln
0.0%
jan 1, 1978
1.928 bln
+197.452 mln
11.41%
jan 1, 1979
2.153 bln
+224.998 mln
11.67%
jan 1, 1980
2.933 bln
+779.658 mln
36.21%
jan 1, 1981
3.766 bln
+833.238 mln
28.41%
jan 1, 1982
4.032 bln
+266.104 mln
7.07%
jan 1, 1983
3.779 bln
-253.315 mln
-6.28%
jan 1, 1984
3.562 bln
-216.304 mln
-5.72%
jan 1, 1985
3.559 bln
-3.021 mln
-0.08%
jan 1, 1986
3.206 bln
-353.794 mln
-9.94%
jan 1, 1987
3.368 bln
+162.106 mln
5.06%
jan 1, 1988
3.492 bln
+124.74 mln
3.7%
jan 1, 1989
4.246 bln
+753.35 mln
21.57%
jan 1, 1990
4.854 bln
+608.272 mln
14.33%
jan 1, 1991
6.039 bln
+1.185 bln
24.41%
jan 1, 1992
5.736 bln
-302.304 mln
-5.01%
jan 1, 1993
7.236 bln
+1.5 bln
26.15%
jan 1, 1994
7.166 bln
-70.085 mln
-0.97%
jan 1, 1995
7.572 bln
+405.331 mln
5.66%
jan 1, 1996
8.811 bln
+1.239 bln
16.37%
jan 1, 1997
8.524 bln
-287.338 mln
-3.26%
jan 1, 1998
8.696 bln
+172.361 mln
2.02%
jan 1, 1999
9.074 bln
+378.165 mln
4.35%
jan 1, 2000
9.191 bln
+117.158 mln
1.29%
jan 1, 2001
9.263 bln
+71.921 mln
0.78%
jan 1, 2002
10.346 bln
+1.083 bln
11.69%
jan 1, 2003
10.359 bln
+13.13 mln
0.13%
jan 1, 2004
11.836 bln
+1.477 bln
14.25%
jan 1, 2005
14.18 bln
+2.344 bln
19.81%
jan 1, 2006
14.701 bln
+520.882 mln
3.67%
jan 1, 2007
16.564 bln
+1.863 bln
12.67%
jan 1, 2008
20.733 bln
+4.17 bln
25.17%
jan 1, 2009
26.446 bln
+5.713 bln
27.55%
jan 1, 2010
20.989 bln
-5.457 bln
-20.63%
jan 1, 2011
24.24 bln
+3.25 bln
15.49%
jan 1, 2012
25.801 bln
+1.561 bln
6.44%
jan 1, 2013
26.298 bln
+497.009 mln
1.93%
jan 1, 2014
26.285 bln
-12.513 mln
-0.05%
jan 1, 2015
26.803 bln
+517.727 mln
1.97%
jan 1, 2016
22.18 bln
-4.623 bln
-17.25%
Ranking of countries by current statistics by years


Comments: