29
/
en
AIzaSyAYiBZKx7MnpbEhh9jyipgxe19OcubqV5w
April 1, 2024
187913
Malaysia
MYS
true
2
1
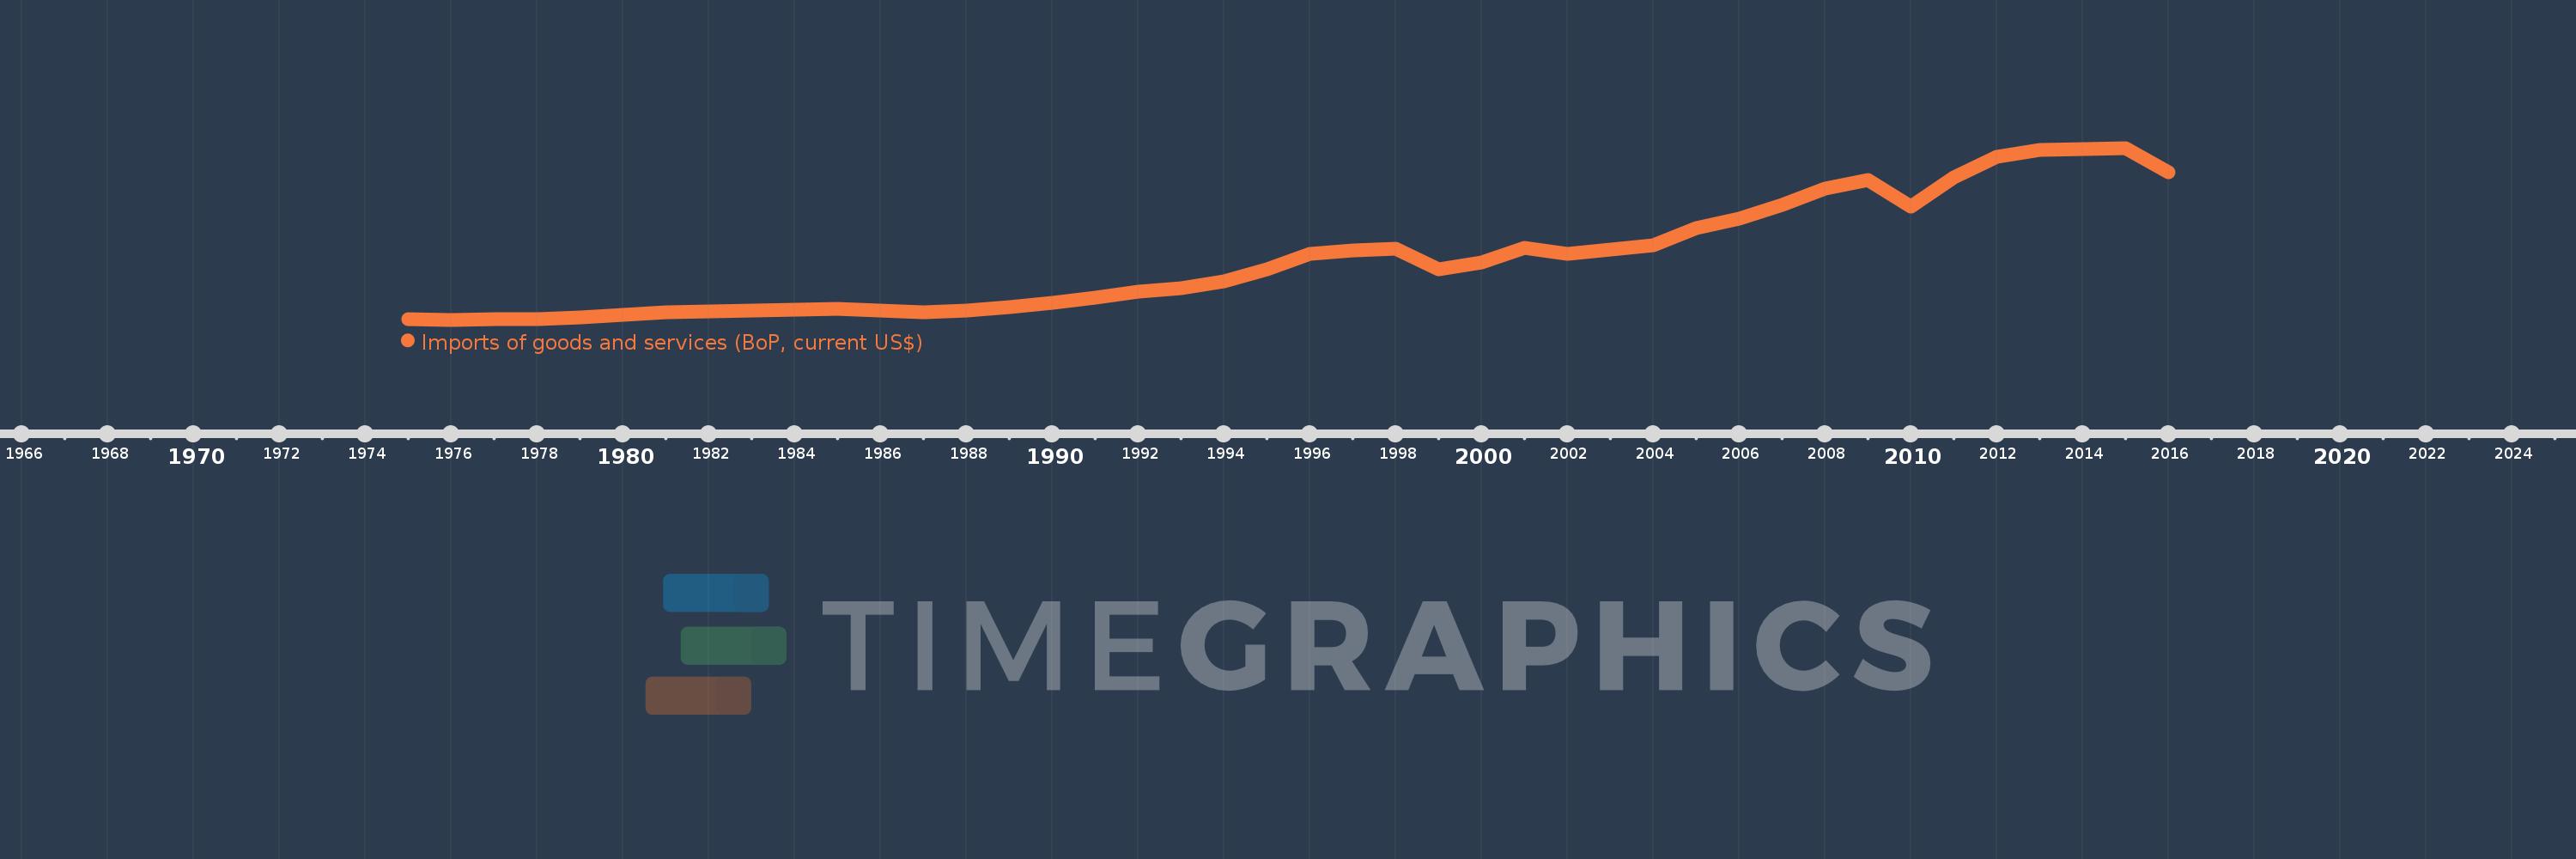
Imports of goods and services (BoP, current US$)
2016,2015,2014,2013,2012,2011,2010,2009,2008,2007,2006,2005,2004,2003,2002,2001,2000,1999,1998,1997,1996,1995,1994,1993,1992,1991,1990,1989,1988,1987,1986,1985,1984,1983,1982,1981,1980,1979,1978,1977,1976,1975
This statistics in other country:
AfghanistanAlbaniaAlgeriaAngolaAntigua and BarbudaArab WorldArgentinaArmeniaArubaAustraliaAustriaAzerbaijanBahamas, TheBahrainBangladeshBarbadosBelarusBelgiumBelizeBeninBermudaBhutanBoliviaBosnia and HerzegovinaBotswanaBrazilBrunei DarussalamBulgariaBurkina FasoBurundiCabo VerdeCambodiaCameroonCanadaCaribbean small statesCentral African RepublicCentral Europe and the BalticsChadChileChinaColombiaComorosCongo, Dem. Rep.Congo, Rep.Costa RicaCote d'IvoireCroatiaCuracaoCyprusCzech RepublicDenmarkDjiboutiDominicaDominican RepublicEarly-demographic dividendEast Asia & PacificEast Asia & Pacific (excluding high income)East Asia & Pacific (IDA & IBRD countries)EcuadorEgypt, Arab Rep.El SalvadorEquatorial GuineaEritreaEstoniaEthiopiaEuro areaEurope & Central AsiaEurope & Central Asia (excluding high income)Europe & Central Asia (IDA & IBRD countries)European UnionFaroe IslandsFijiFinlandFragile and conflict affected situationsFranceFrench PolynesiaGabonGambia, TheGeorgiaGermanyGhanaGreeceGrenadaGuatemalaGuineaGuinea-BissauGuyanaHaitiHeavily indebted poor countries (HIPC)High incomeHondurasHong Kong SAR, ChinaHungaryIBRD onlyIcelandIDA & IBRD totalIDA blendIDA onlyIDA totalIndiaIndonesiaIran, Islamic Rep.IraqIrelandIsraelItalyJamaicaJapanJordanKazakhstanKenyaKiribatiKorea, Rep.KosovoKuwaitKyrgyz RepublicLao PDRLate-demographic dividendLatin America & Caribbean Latin America & Caribbean (excluding high income)Latin America & the Caribbean (IDA & IBRD countries)LatviaLeast developed countries: UN classificationLebanonLesothoLiberiaLibyaLithuaniaLow & middle incomeLow incomeLower middle incomeLuxembourgMacao SAR, ChinaMacedonia, FYRMadagascarMalawiMalaysiaMaldivesMaliMaltaMarshall IslandsMauritaniaMauritiusMexicoMicronesia, Fed. Sts.Middle East & North Africa (excluding high income)Middle East & North Africa (IDA & IBRD countries)Middle incomeMoldovaMongoliaMontenegroMoroccoMozambiqueMyanmarNamibiaNepalNetherlandsNew CaledoniaNicaraguaNigerNigeriaNorth AmericaNorwayOECD membersOmanOther small statesPacific island small statesPakistanPalauPanamaPapua New GuineaParaguayPeruPhilippinesPolandPortugalPost-demographic dividendPre-demographic dividendQatarRomaniaRussian FederationRwandaSamoaSao Tome and PrincipeSaudi ArabiaSenegalSerbiaSeychellesSierra LeoneSingaporeSint Maarten (Dutch part)Slovak RepublicSloveniaSmall statesSolomon IslandsSouth AfricaSouth AsiaSouth Asia (IDA & IBRD)South SudanSpainSri LankaSt. Kitts and NevisSt. LuciaSt. Vincent and the GrenadinesSub-Saharan Africa Sub-Saharan Africa (excluding high income)Sub-Saharan Africa (IDA & IBRD countries)SudanSurinameSwazilandSwedenSwitzerlandSyrian Arab RepublicTajikistanTanzaniaThailandTimor-LesteTogoTongaTrinidad and TobagoTunisiaTurkeyTuvaluUgandaUkraineUnited KingdomUnited StatesUpper middle incomeUruguayVanuatuVenezuela, RBVietnamWest Bank and GazaWorldYemen, Rep.ZambiaZimbabwe Timeline:
This timeline shows a graph from 1975 to 2016 of Malaysia. No data until 1974. Number of actual observations by date: 42.
Source name:
World Development Indicators
Source organization:
International Monetary Fund, Balance of Payments Statistics Yearbook and data files.
Categories, topics:
Economy & Growth, Trade
Last updated:
apr 23, 2017
Indicators value changes by year
Minimum:
4.399 bln
jan 1, 1976
Maximum:
218.197 bln
jan 1, 2015
At the date of observation
Value
Absolute change
Change from previous value
jan 1, 1975
4.657 bln
+4.657 bln
0.0%
jan 1, 1976
4.399 bln
-257.809 mln
-5.54%
jan 1, 1977
4.644 bln
+244.659 mln
5.56%
jan 1, 1978
5.602 bln
+957.985 mln
20.63%
jan 1, 1979
7.119 bln
+1.517 bln
27.08%
jan 1, 1980
10.022 bln
+2.903 bln
40.77%
jan 1, 1981
13.526 bln
+3.504 bln
34.96%
jan 1, 1982
14.742 bln
+1.216 bln
8.99%
jan 1, 1983
16.071 bln
+1.329 bln
9.01%
jan 1, 1984
17.33 bln
+1.26 bln
7.84%
jan 1, 1985
17.844 bln
+513.707 mln
2.96%
jan 1, 1986
15.604 bln
-2.24 bln
-12.55%
jan 1, 1987
14.016 bln
-1.588 bln
-10.18%
jan 1, 1988
15.688 bln
+1.672 bln
11.93%
jan 1, 1989
19.759 bln
+4.071 bln
25.95%
jan 1, 1990
25.29 bln
+5.531 bln
27.99%
jan 1, 1991
31.765 bln
+6.475 bln
25.6%
jan 1, 1992
39.885 bln
+8.12 bln
25.56%
jan 1, 1993
44.008 bln
+4.123 bln
10.34%
jan 1, 1994
52.717 bln
+8.709 bln
19.79%
jan 1, 1995
67.372 bln
+14.655 bln
27.8%
jan 1, 1996
86.851 bln
+19.479 bln
28.91%
jan 1, 1997
90.71 bln
+3.858 bln
4.44%
jan 1, 1998
92.325 bln
+1.616 bln
1.78%
jan 1, 1999
67.505 bln
-24.821 bln
-26.88%
jan 1, 2000
76.139 bln
+8.635 bln
12.79%
jan 1, 2001
94.267 bln
+18.127 bln
23.81%
jan 1, 2002
86.181 bln
-8.085 bln
-8.58%
jan 1, 2003
91.669 bln
+5.488 bln
6.37%
jan 1, 2004
96.813 bln
+5.144 bln
5.61%
jan 1, 2005
118.486 bln
+21.672 bln
22.39%
jan 1, 2006
130.577 bln
+12.091 bln
10.2%
jan 1, 2007
147.094 bln
+16.517 bln
12.65%
jan 1, 2008
167.101 bln
+20.006 bln
13.6%
jan 1, 2009
178.661 bln
+11.561 bln
6.92%
jan 1, 2010
144.799 bln
-33.863 bln
-18.95%
jan 1, 2011
181.577 bln
+36.779 bln
25.4%
jan 1, 2012
207.57 bln
+25.993 bln
14.32%
jan 1, 2013
215.501 bln
+7.93 bln
3.82%
jan 1, 2014
216.845 bln
+1.345 bln
0.62%
jan 1, 2015
218.197 bln
+1.352 bln
0.62%
jan 1, 2016
187.684 bln
-30.514 bln
-13.98%
Ranking of countries by current statistics by years


Comments: