29
/
en
AIzaSyAYiBZKx7MnpbEhh9jyipgxe19OcubqV5w
April 1, 2024
199270
Mongolia
MNG
true
2
1
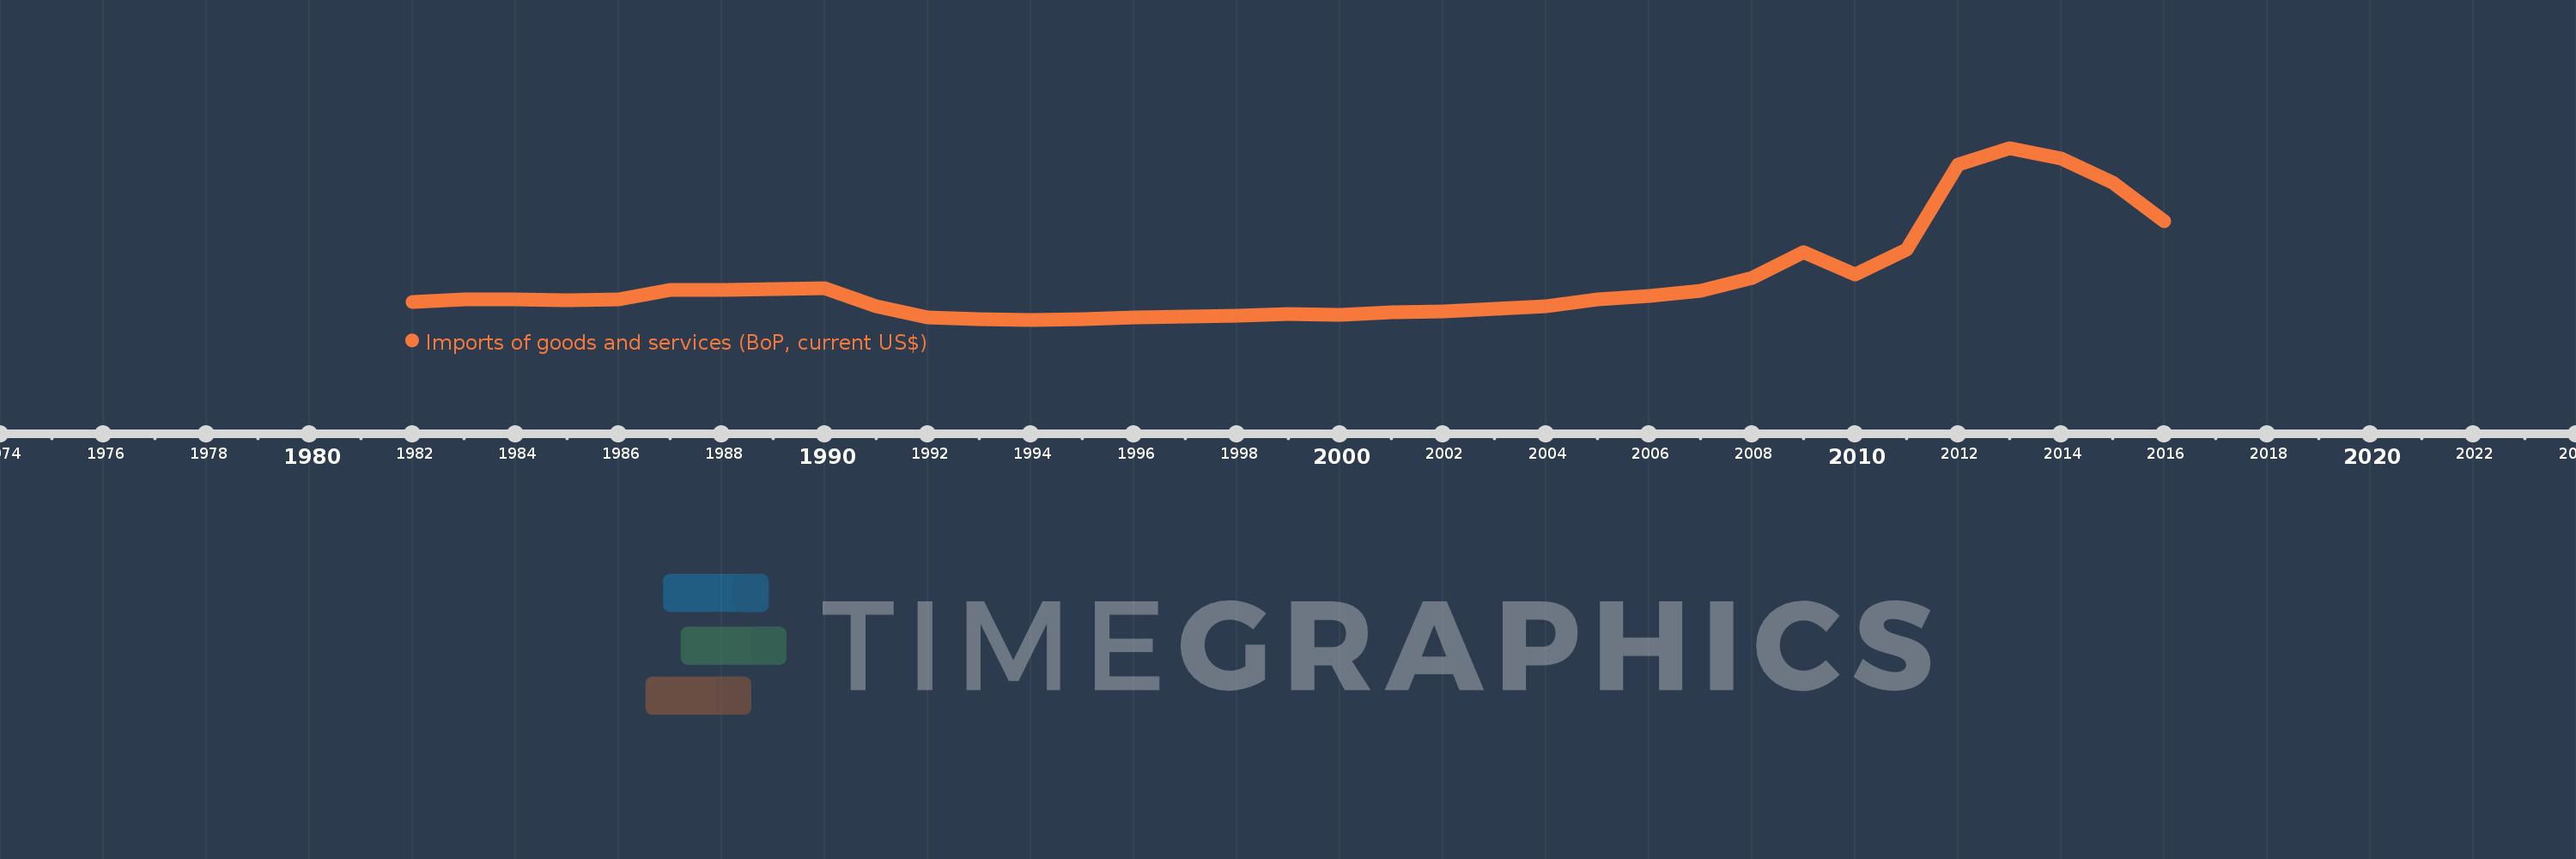
Imports of goods and services (BoP, current US$)
2016,2015,2014,2013,2012,2011,2010,2009,2008,2007,2006,2005,2004,2003,2002,2001,2000,1999,1998,1997,1996,1995,1994,1993,1992,1991,1990,1989,1988,1987,1986,1985,1984,1983,1982
This statistics in other country:
AfghanistanAlbaniaAlgeriaAngolaAntigua and BarbudaArab WorldArgentinaArmeniaArubaAustraliaAustriaAzerbaijanBahamas, TheBahrainBangladeshBarbadosBelarusBelgiumBelizeBeninBermudaBhutanBoliviaBosnia and HerzegovinaBotswanaBrazilBrunei DarussalamBulgariaBurkina FasoBurundiCabo VerdeCambodiaCameroonCanadaCaribbean small statesCentral African RepublicCentral Europe and the BalticsChadChileChinaColombiaComorosCongo, Dem. Rep.Congo, Rep.Costa RicaCote d'IvoireCroatiaCuracaoCyprusCzech RepublicDenmarkDjiboutiDominicaDominican RepublicEarly-demographic dividendEast Asia & PacificEast Asia & Pacific (excluding high income)East Asia & Pacific (IDA & IBRD countries)EcuadorEgypt, Arab Rep.El SalvadorEquatorial GuineaEritreaEstoniaEthiopiaEuro areaEurope & Central AsiaEurope & Central Asia (excluding high income)Europe & Central Asia (IDA & IBRD countries)European UnionFaroe IslandsFijiFinlandFragile and conflict affected situationsFranceFrench PolynesiaGabonGambia, TheGeorgiaGermanyGhanaGreeceGrenadaGuatemalaGuineaGuinea-BissauGuyanaHaitiHeavily indebted poor countries (HIPC)High incomeHondurasHong Kong SAR, ChinaHungaryIBRD onlyIcelandIDA & IBRD totalIDA blendIDA onlyIDA totalIndiaIndonesiaIran, Islamic Rep.IraqIrelandIsraelItalyJamaicaJapanJordanKazakhstanKenyaKiribatiKorea, Rep.KosovoKuwaitKyrgyz RepublicLao PDRLate-demographic dividendLatin America & Caribbean Latin America & Caribbean (excluding high income)Latin America & the Caribbean (IDA & IBRD countries)LatviaLeast developed countries: UN classificationLebanonLesothoLiberiaLibyaLithuaniaLow & middle incomeLow incomeLower middle incomeLuxembourgMacao SAR, ChinaMacedonia, FYRMadagascarMalawiMalaysiaMaldivesMaliMaltaMarshall IslandsMauritaniaMauritiusMexicoMicronesia, Fed. Sts.Middle East & North Africa (excluding high income)Middle East & North Africa (IDA & IBRD countries)Middle incomeMoldovaMongoliaMontenegroMoroccoMozambiqueMyanmarNamibiaNepalNetherlandsNew CaledoniaNicaraguaNigerNigeriaNorth AmericaNorwayOECD membersOmanOther small statesPacific island small statesPakistanPalauPanamaPapua New GuineaParaguayPeruPhilippinesPolandPortugalPost-demographic dividendPre-demographic dividendQatarRomaniaRussian FederationRwandaSamoaSao Tome and PrincipeSaudi ArabiaSenegalSerbiaSeychellesSierra LeoneSingaporeSint Maarten (Dutch part)Slovak RepublicSloveniaSmall statesSolomon IslandsSouth AfricaSouth AsiaSouth Asia (IDA & IBRD)South SudanSpainSri LankaSt. Kitts and NevisSt. LuciaSt. Vincent and the GrenadinesSub-Saharan Africa Sub-Saharan Africa (excluding high income)Sub-Saharan Africa (IDA & IBRD countries)SudanSurinameSwazilandSwedenSwitzerlandSyrian Arab RepublicTajikistanTanzaniaThailandTimor-LesteTogoTongaTrinidad and TobagoTunisiaTurkeyTuvaluUgandaUkraineUnited KingdomUnited StatesUpper middle incomeUruguayVanuatuVenezuela, RBVietnamWest Bank and GazaWorldYemen, Rep.ZambiaZimbabwe Timeline:
This timeline shows a graph from 1982 to 2016 of Mongolia. No data until 1981. Number of actual observations by date: 35.
Source name:
World Development Indicators
Source organization:
International Monetary Fund, Balance of Payments Statistics Yearbook and data files.
Categories, topics:
Economy & Growth, Trade
Last updated:
apr 23, 2017
Indicators value changes by year
Minimum:
404.05 mln
jan 1, 1994
Maximum:
8.909 bln
jan 1, 2013
At the date of observation
Value
Absolute change
Change from previous value
jan 1, 1982
1.272 bln
+1.272 bln
0.0%
jan 1, 1983
1.392 bln
+120.2 mln
9.45%
jan 1, 1984
1.405 bln
+12.9 mln
0.93%
jan 1, 1985
1.349 bln
-55.6 mln
-3.96%
jan 1, 1986
1.405 bln
+56.0 mln
4.15%
jan 1, 1987
1.884 bln
+478.4 mln
34.04%
jan 1, 1988
1.885 bln
+1.3 mln
0.07%
jan 1, 1989
1.922 bln
+37.1 mln
1.97%
jan 1, 1990
1.978 bln
+55.42 mln
2.88%
jan 1, 1991
1.076 bln
-901.88 mln
-45.6%
jan 1, 1992
504.15 mln
-571.59 mln
-53.13%
jan 1, 1993
447.14 mln
-57.01 mln
-11.31%
jan 1, 1994
404.05 mln
-43.09 mln
-9.64%
jan 1, 1995
424.56 mln
+20.51 mln
5.08%
jan 1, 1996
521.1 mln
+96.54 mln
22.74%
jan 1, 1997
572.5 mln
+51.4 mln
9.86%
jan 1, 1998
593.12 mln
+20.62 mln
3.6%
jan 1, 1999
671.9 mln
+78.78 mln
13.28%
jan 1, 2000
652.309 mln
-19.591 mln
-2.92%
jan 1, 2001
771.059 mln
+118.749 mln
18.2%
jan 1, 2002
828.802 mln
+57.743 mln
7.49%
jan 1, 2003
946.669 mln
+117.868 mln
14.22%
jan 1, 2004
1.084 bln
+137.299 mln
14.5%
jan 1, 2005
1.406 bln
+321.717 mln
29.68%
jan 1, 2006
1.566 bln
+160.752 mln
11.44%
jan 1, 2007
1.826 bln
+259.863 mln
16.59%
jan 1, 2008
2.467 bln
+641.158 mln
35.11%
jan 1, 2009
3.767 bln
+1.299 bln
52.65%
jan 1, 2010
2.629 bln
-1.138 bln
-30.21%
jan 1, 2011
3.865 bln
+1.236 bln
47.04%
jan 1, 2012
8.095 bln
+4.23 bln
109.43%
jan 1, 2013
8.909 bln
+814.387 mln
10.06%
jan 1, 2014
8.398 bln
-511.665 mln
-5.74%
jan 1, 2015
7.191 bln
-1.206 bln
-14.36%
jan 1, 2016
5.29 bln
-1.902 bln
-26.44%
Ranking of countries by current statistics by years


Comments: