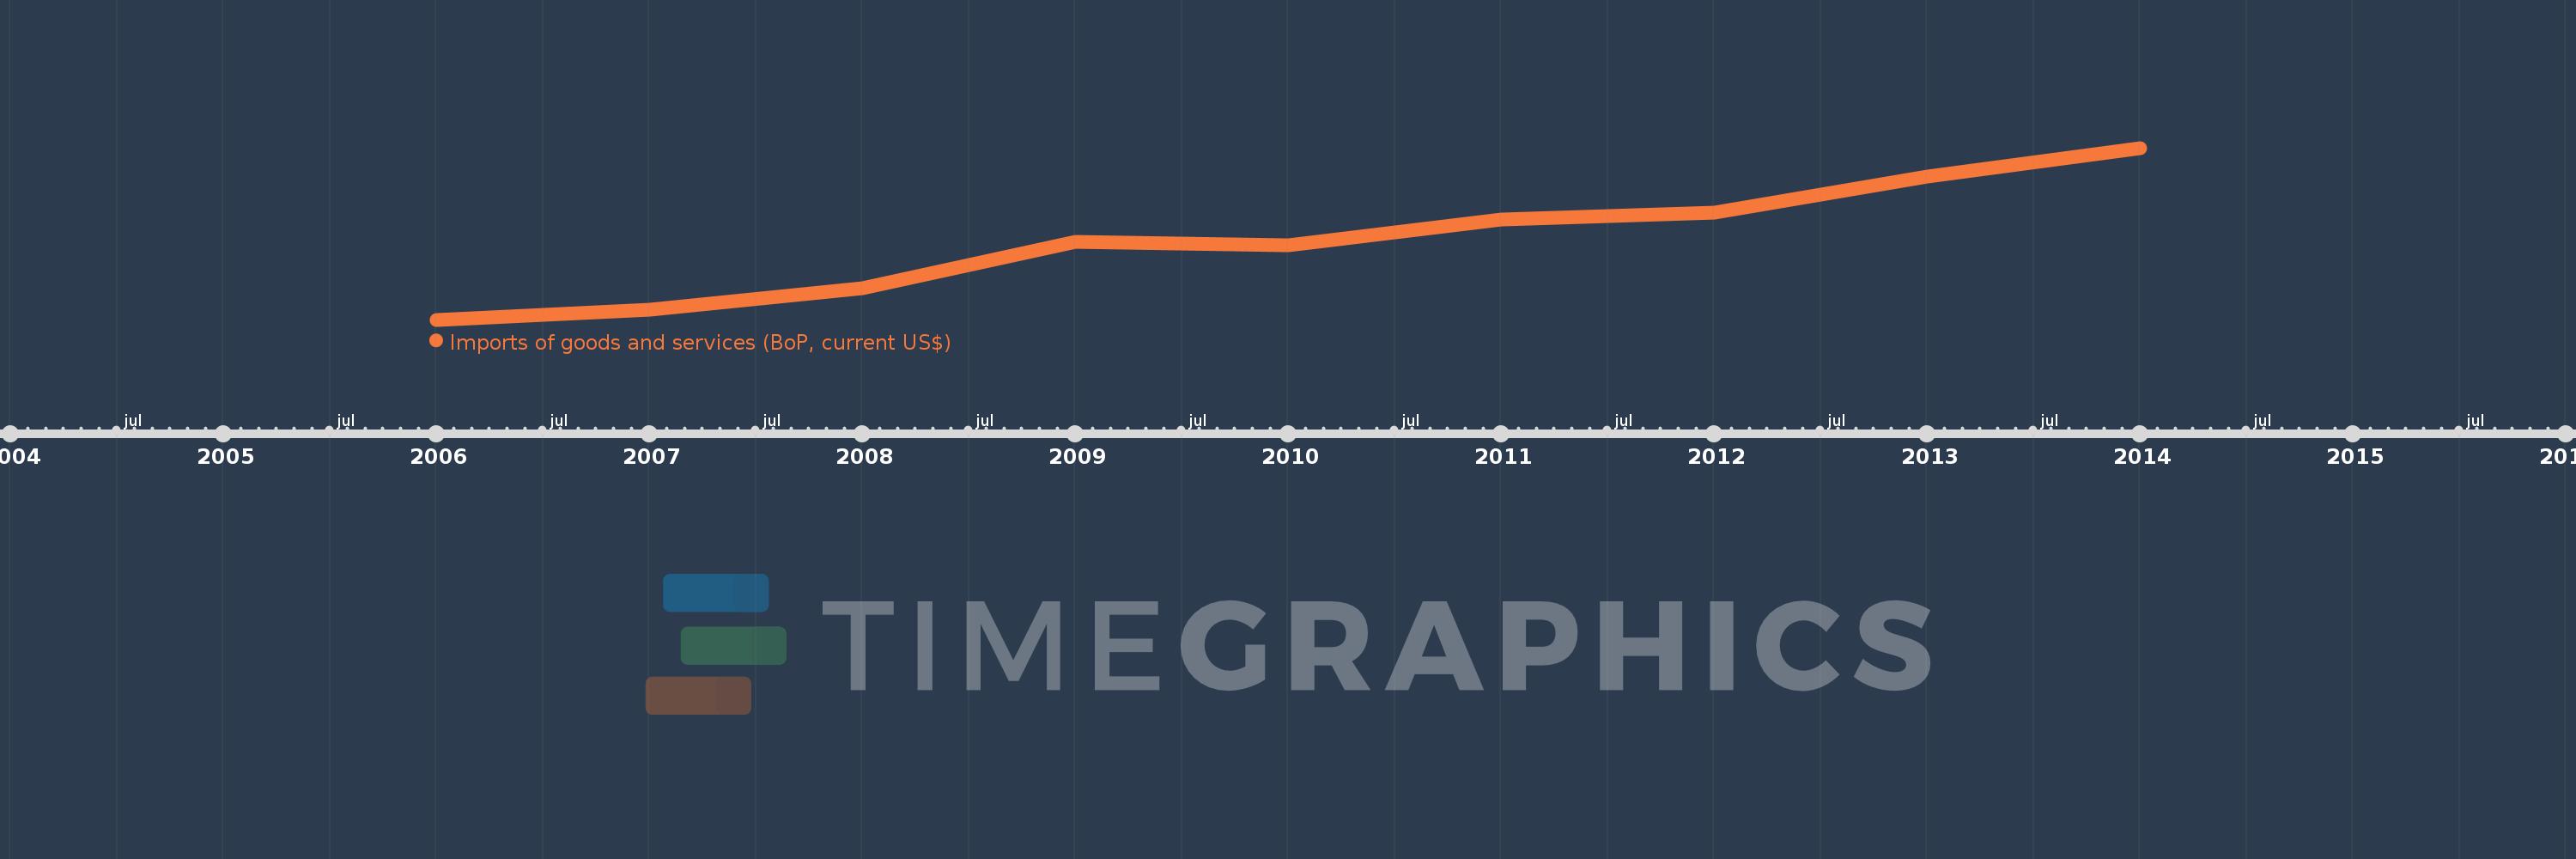
This timeline shows a graph from 2006 to 2014 of Fragile and conflict affected situations. No data until 2005. Number of actual observations by date: 9.
Source name:
World Development Indicators
Source organization:
International Monetary Fund, Balance of Payments Statistics Yearbook and data files.
Categories, topics:
Economy & Growth, Trade
Last updated:
apr 23, 2017
Indicators value changes by year
Meaning:
210.34 bln
Minimum:
125.077 bln
jan 1, 2006
Maximum:
309.057 bln
jan 1, 2014
At the date of observation
Value
Absolute change
Change from the previous value
jan 1, 2006
125.077 bln
+125.077 bln
0.0%
jan 1, 2007
135.737 bln
+10.661 bln
8.52%
jan 1, 2008
158.636 bln
+22.899 bln
16.87%
jan 1, 2009
208.293 bln
+49.656 bln
31.3%
jan 1, 2010
204.622 bln
-3.671 bln
-1.76%
jan 1, 2011
232.828 bln
+28.206 bln
13.78%
jan 1, 2012
239.971 bln
+7.142 bln
3.07%
jan 1, 2013
278.836 bln
+38.866 bln
16.2%
jan 1, 2014
309.057 bln
+30.22 bln
10.84%
Ranking of countries by current statistics by years
