29
/
en
AIzaSyAYiBZKx7MnpbEhh9jyipgxe19OcubqV5w
April 1, 2024
189109
Maldives
MDV
true
2
1
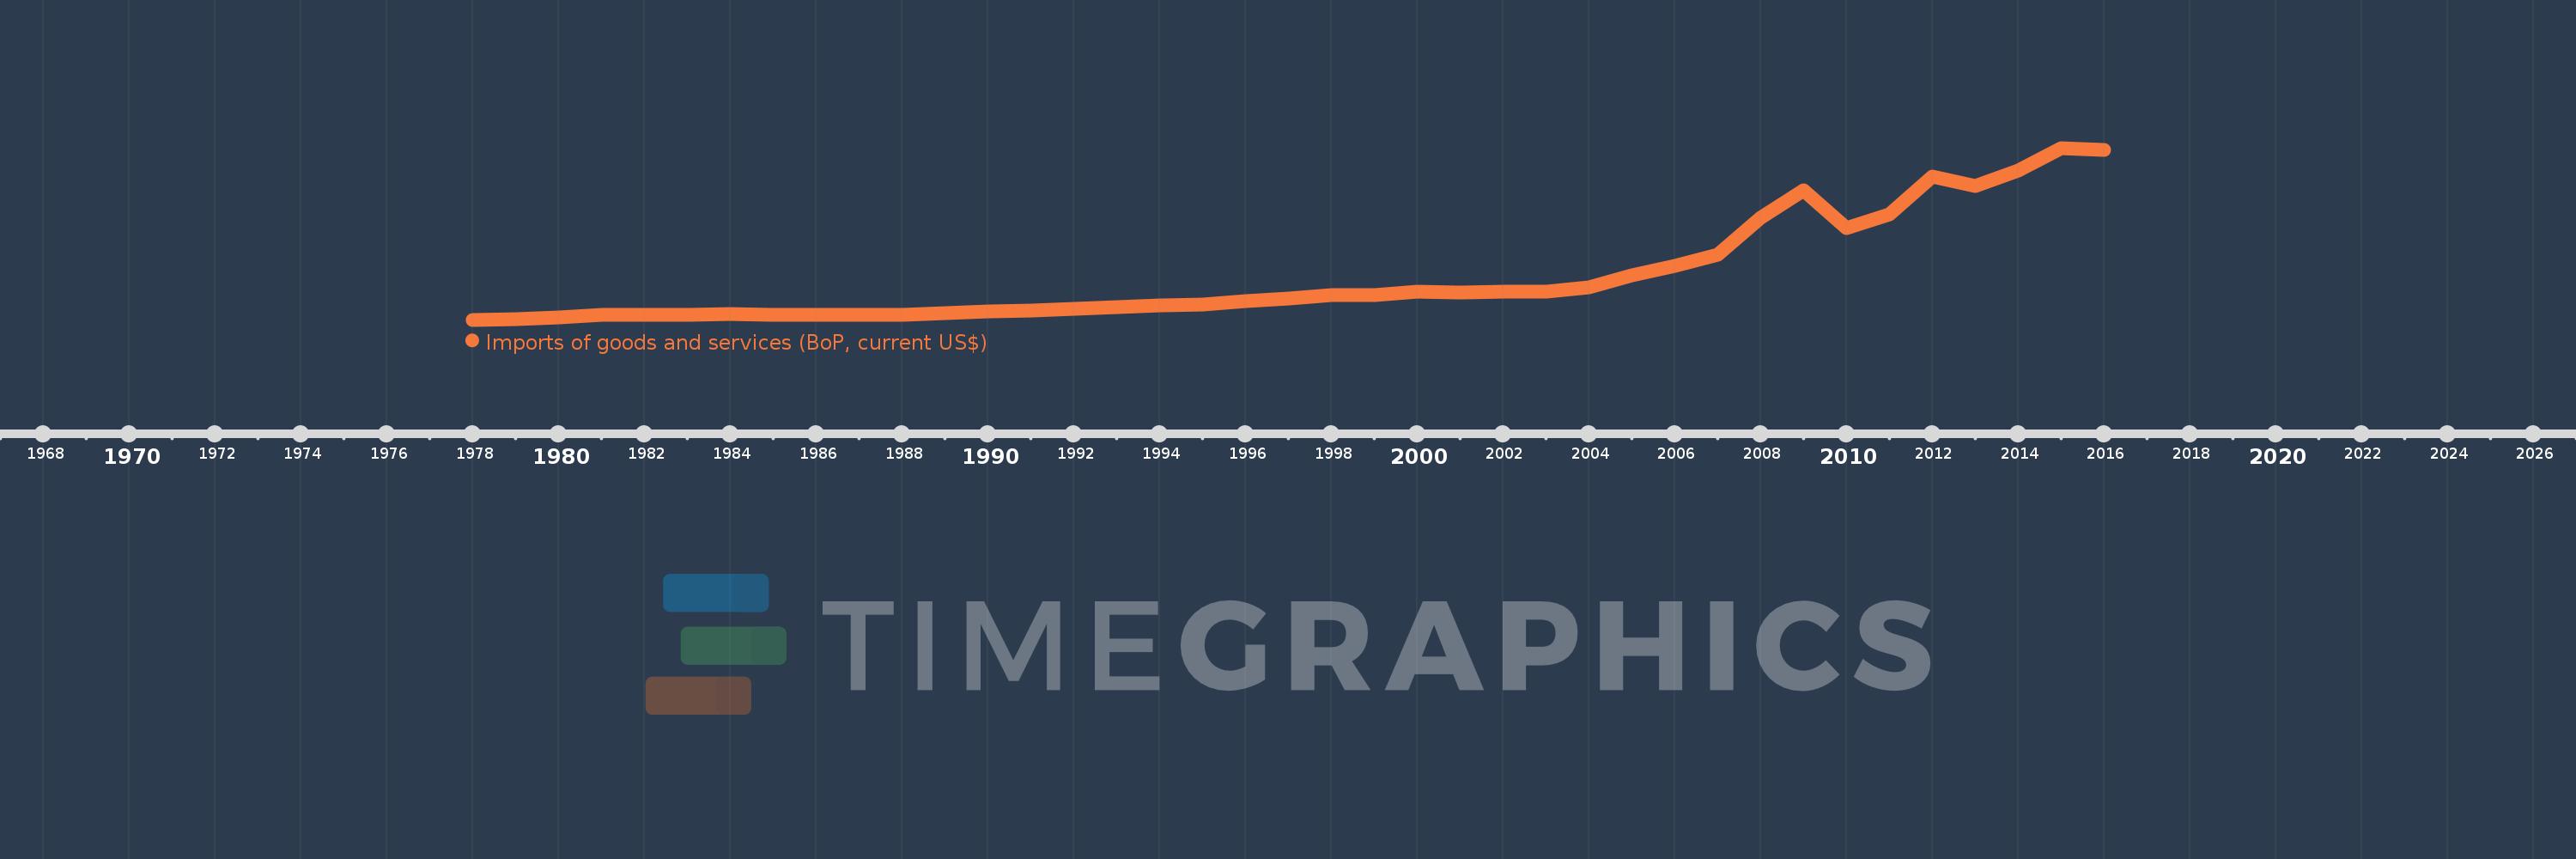
Imports of goods and services (BoP, current US$)
2016,2015,2014,2013,2012,2011,2010,2009,2008,2007,2006,2005,2004,2003,2002,2001,2000,1999,1998,1997,1996,1995,1994,1993,1992,1991,1990,1989,1988,1987,1986,1985,1984,1983,1982,1981,1980,1979,1978
This statistics in other country:
AfghanistanAlbaniaAlgeriaAngolaAntigua and BarbudaArab WorldArgentinaArmeniaArubaAustraliaAustriaAzerbaijanBahamas, TheBahrainBangladeshBarbadosBelarusBelgiumBelizeBeninBermudaBhutanBoliviaBosnia and HerzegovinaBotswanaBrazilBrunei DarussalamBulgariaBurkina FasoBurundiCabo VerdeCambodiaCameroonCanadaCaribbean small statesCentral African RepublicCentral Europe and the BalticsChadChileChinaColombiaComorosCongo, Dem. Rep.Congo, Rep.Costa RicaCote d'IvoireCroatiaCuracaoCyprusCzech RepublicDenmarkDjiboutiDominicaDominican RepublicEarly-demographic dividendEast Asia & PacificEast Asia & Pacific (excluding high income)East Asia & Pacific (IDA & IBRD countries)EcuadorEgypt, Arab Rep.El SalvadorEquatorial GuineaEritreaEstoniaEthiopiaEuro areaEurope & Central AsiaEurope & Central Asia (excluding high income)Europe & Central Asia (IDA & IBRD countries)European UnionFaroe IslandsFijiFinlandFragile and conflict affected situationsFranceFrench PolynesiaGabonGambia, TheGeorgiaGermanyGhanaGreeceGrenadaGuatemalaGuineaGuinea-BissauGuyanaHaitiHeavily indebted poor countries (HIPC)High incomeHondurasHong Kong SAR, ChinaHungaryIBRD onlyIcelandIDA & IBRD totalIDA blendIDA onlyIDA totalIndiaIndonesiaIran, Islamic Rep.IraqIrelandIsraelItalyJamaicaJapanJordanKazakhstanKenyaKiribatiKorea, Rep.KosovoKuwaitKyrgyz RepublicLao PDRLate-demographic dividendLatin America & Caribbean Latin America & Caribbean (excluding high income)Latin America & the Caribbean (IDA & IBRD countries)LatviaLeast developed countries: UN classificationLebanonLesothoLiberiaLibyaLithuaniaLow & middle incomeLow incomeLower middle incomeLuxembourgMacao SAR, ChinaMacedonia, FYRMadagascarMalawiMalaysiaMaldivesMaliMaltaMarshall IslandsMauritaniaMauritiusMexicoMicronesia, Fed. Sts.Middle East & North Africa (excluding high income)Middle East & North Africa (IDA & IBRD countries)Middle incomeMoldovaMongoliaMontenegroMoroccoMozambiqueMyanmarNamibiaNepalNetherlandsNew CaledoniaNicaraguaNigerNigeriaNorth AmericaNorwayOECD membersOmanOther small statesPacific island small statesPakistanPalauPanamaPapua New GuineaParaguayPeruPhilippinesPolandPortugalPost-demographic dividendPre-demographic dividendQatarRomaniaRussian FederationRwandaSamoaSao Tome and PrincipeSaudi ArabiaSenegalSerbiaSeychellesSierra LeoneSingaporeSint Maarten (Dutch part)Slovak RepublicSloveniaSmall statesSolomon IslandsSouth AfricaSouth AsiaSouth Asia (IDA & IBRD)South SudanSpainSri LankaSt. Kitts and NevisSt. LuciaSt. Vincent and the GrenadinesSub-Saharan Africa Sub-Saharan Africa (excluding high income)Sub-Saharan Africa (IDA & IBRD countries)SudanSurinameSwazilandSwedenSwitzerlandSyrian Arab RepublicTajikistanTanzaniaThailandTimor-LesteTogoTongaTrinidad and TobagoTunisiaTurkeyTuvaluUgandaUkraineUnited KingdomUnited StatesUpper middle incomeUruguayVanuatuVenezuela, RBVietnamWest Bank and GazaWorldYemen, Rep.ZambiaZimbabwe Timeline:
This timeline shows a graph from 1978 to 2016 of Maldives. No data until 1977. Number of actual observations by date: 39.
Source name:
World Development Indicators
Source organization:
International Monetary Fund, Balance of Payments Statistics Yearbook and data files.
Categories, topics:
Economy & Growth, Trade
Last updated:
apr 23, 2017
Indicators value changes by year
Minimum:
10.9 mln
jan 1, 1978
Maximum:
2.754 bln
jan 1, 2015
At the date of observation
Value
Absolute change
Change from previous value
jan 1, 1978
10.9 mln
+10.9 mln
0.0%
jan 1, 1979
16.2 mln
+5.3 mln
48.62%
jan 1, 1980
46.7 mln
+30.5 mln
188.27%
jan 1, 1981
87.1 mln
+40.4 mln
86.51%
jan 1, 1982
93.6 mln
+6.5 mln
7.46%
jan 1, 1983
93.7 mln
+100.0K
0.11%
jan 1, 1984
96.5 mln
+2.8 mln
2.99%
jan 1, 1985
95.2 mln
-1.3 mln
-1.35%
jan 1, 1986
85.0 mln
-10.2 mln
-10.71%
jan 1, 1987
86.249 mln
+1.249 mln
1.47%
jan 1, 1988
94.89 mln
+8.641 mln
10.02%
jan 1, 1989
115.76 mln
+20.87 mln
21.99%
jan 1, 1990
140.188 mln
+24.428 mln
21.1%
jan 1, 1991
159.227 mln
+19.039 mln
13.58%
jan 1, 1992
183.94 mln
+24.713 mln
15.52%
jan 1, 1993
217.3 mln
+33.36 mln
18.14%
jan 1, 1994
234.965 mln
+17.665 mln
8.13%
jan 1, 1995
257.884 mln
+22.919 mln
9.75%
jan 1, 1996
312.475 mln
+54.591 mln
21.17%
jan 1, 1997
353.457 mln
+40.983 mln
13.12%
jan 1, 1998
401.179 mln
+47.722 mln
13.5%
jan 1, 1999
410.364 mln
+9.185 mln
2.29%
jan 1, 2000
462.033 mln
+51.668 mln
12.59%
jan 1, 2001
451.654 mln
-10.379 mln
-2.25%
jan 1, 2002
456.069 mln
+4.415 mln
0.98%
jan 1, 2003
455.862 mln
-206.83K
-0.05%
jan 1, 2004
534.559 mln
+78.697 mln
17.26%
jan 1, 2005
722.228 mln
+187.67 mln
35.11%
jan 1, 2006
868.552 mln
+146.323 mln
20.26%
jan 1, 2007
1.047 bln
+177.953 mln
20.49%
jan 1, 2008
1.636 bln
+589.182 mln
56.3%
jan 1, 2009
2.077 bln
+441.278 mln
26.98%
jan 1, 2010
1.48 bln
-596.933 mln
-28.74%
jan 1, 2011
1.693 bln
+213.171 mln
14.4%
jan 1, 2012
2.298 bln
+604.643 mln
35.71%
jan 1, 2013
2.146 bln
-151.401 mln
-6.59%
jan 1, 2014
2.4 bln
+253.096 mln
11.79%
jan 1, 2015
2.754 bln
+354.396 mln
14.77%
jan 1, 2016
2.724 bln
-30.161 mln
-1.1%
Ranking of countries by current statistics by years


Comments: