29
/
en
AIzaSyAYiBZKx7MnpbEhh9jyipgxe19OcubqV5w
April 1, 2024
47222
Lower middle income
LMC
false
2
1
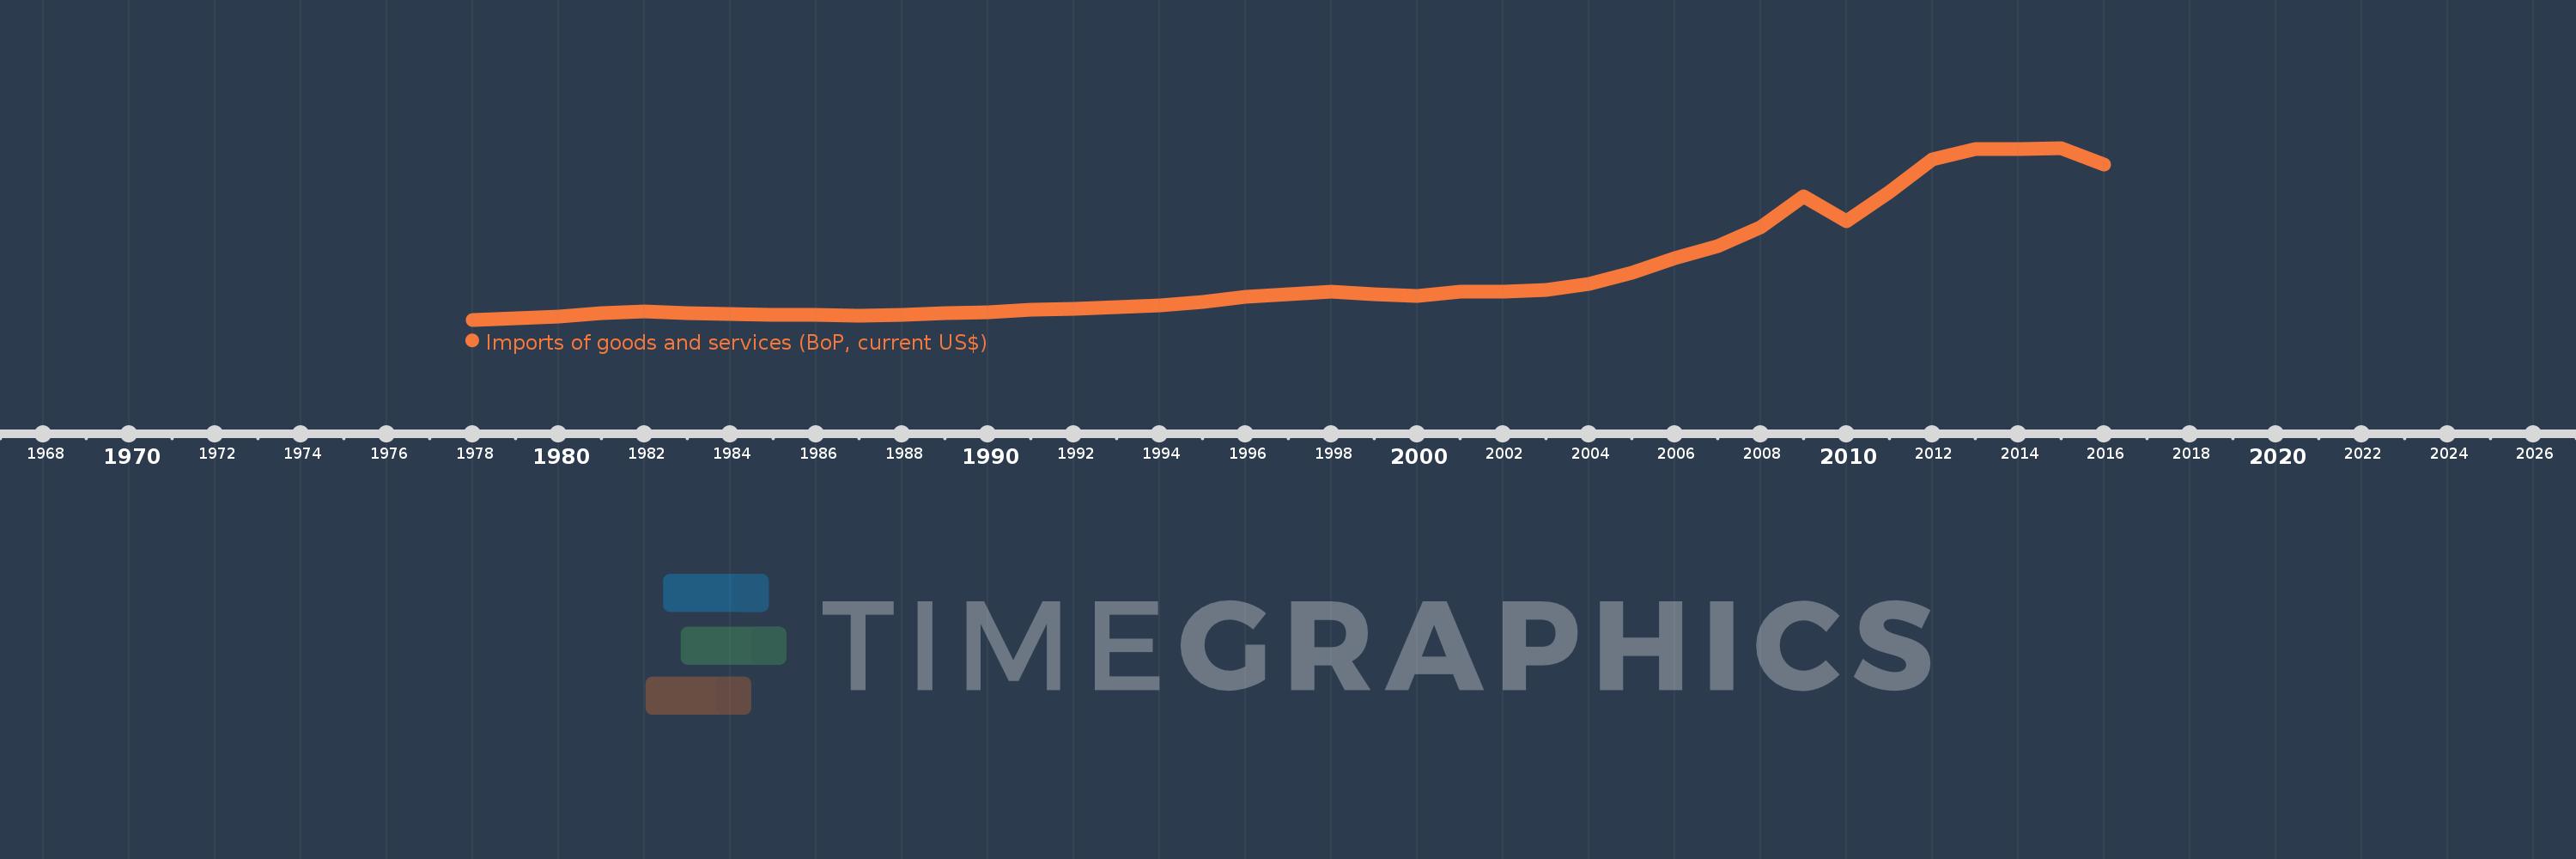
Imports of goods and services (BoP, current US$)
2016,2015,2014,2013,2012,2011,2010,2009,2008,2007,2006,2005,2004,2003,2002,2001,2000,1999,1998,1997,1996,1995,1994,1993,1992,1991,1990,1989,1988,1987,1986,1985,1984,1983,1982,1981,1980,1979,1978
This statistics in other country:
AfghanistanAlbaniaAlgeriaAngolaAntigua and BarbudaArab WorldArgentinaArmeniaArubaAustraliaAustriaAzerbaijanBahamas, TheBahrainBangladeshBarbadosBelarusBelgiumBelizeBeninBermudaBhutanBoliviaBosnia and HerzegovinaBotswanaBrazilBrunei DarussalamBulgariaBurkina FasoBurundiCabo VerdeCambodiaCameroonCanadaCaribbean small statesCentral African RepublicCentral Europe and the BalticsChadChileChinaColombiaComorosCongo, Dem. Rep.Congo, Rep.Costa RicaCote d'IvoireCroatiaCuracaoCyprusCzech RepublicDenmarkDjiboutiDominicaDominican RepublicEarly-demographic dividendEast Asia & PacificEast Asia & Pacific (excluding high income)East Asia & Pacific (IDA & IBRD countries)EcuadorEgypt, Arab Rep.El SalvadorEquatorial GuineaEritreaEstoniaEthiopiaEuro areaEurope & Central AsiaEurope & Central Asia (excluding high income)Europe & Central Asia (IDA & IBRD countries)European UnionFaroe IslandsFijiFinlandFragile and conflict affected situationsFranceFrench PolynesiaGabonGambia, TheGeorgiaGermanyGhanaGreeceGrenadaGuatemalaGuineaGuinea-BissauGuyanaHaitiHeavily indebted poor countries (HIPC)High incomeHondurasHong Kong SAR, ChinaHungaryIBRD onlyIcelandIDA & IBRD totalIDA blendIDA onlyIDA totalIndiaIndonesiaIran, Islamic Rep.IraqIrelandIsraelItalyJamaicaJapanJordanKazakhstanKenyaKiribatiKorea, Rep.KosovoKuwaitKyrgyz RepublicLao PDRLate-demographic dividendLatin America & Caribbean Latin America & Caribbean (excluding high income)Latin America & the Caribbean (IDA & IBRD countries)LatviaLeast developed countries: UN classificationLebanonLesothoLiberiaLibyaLithuaniaLow & middle incomeLow incomeLower middle incomeLuxembourgMacao SAR, ChinaMacedonia, FYRMadagascarMalawiMalaysiaMaldivesMaliMaltaMarshall IslandsMauritaniaMauritiusMexicoMicronesia, Fed. Sts.Middle East & North Africa (excluding high income)Middle East & North Africa (IDA & IBRD countries)Middle incomeMoldovaMongoliaMontenegroMoroccoMozambiqueMyanmarNamibiaNepalNetherlandsNew CaledoniaNicaraguaNigerNigeriaNorth AmericaNorwayOECD membersOmanOther small statesPacific island small statesPakistanPalauPanamaPapua New GuineaParaguayPeruPhilippinesPolandPortugalPost-demographic dividendPre-demographic dividendQatarRomaniaRussian FederationRwandaSamoaSao Tome and PrincipeSaudi ArabiaSenegalSerbiaSeychellesSierra LeoneSingaporeSint Maarten (Dutch part)Slovak RepublicSloveniaSmall statesSolomon IslandsSouth AfricaSouth AsiaSouth Asia (IDA & IBRD)South SudanSpainSri LankaSt. Kitts and NevisSt. LuciaSt. Vincent and the GrenadinesSub-Saharan Africa Sub-Saharan Africa (excluding high income)Sub-Saharan Africa (IDA & IBRD countries)SudanSurinameSwazilandSwedenSwitzerlandSyrian Arab RepublicTajikistanTanzaniaThailandTimor-LesteTogoTongaTrinidad and TobagoTunisiaTurkeyTuvaluUgandaUkraineUnited KingdomUnited StatesUpper middle incomeUruguayVanuatuVenezuela, RBVietnamWest Bank and GazaWorldYemen, Rep.ZambiaZimbabwe Timeline:
This timeline shows a graph from 1978 to 2016 of Lower middle income. No data until 1977. Number of actual observations by date: 39.
Source name:
World Development Indicators
Source organization:
International Monetary Fund, Balance of Payments Statistics Yearbook and data files.
Categories, topics:
Economy & Growth, Trade
Last updated:
apr 23, 2017
Indicators value changes by year
Minimum:
81.329 bln
jan 1, 1978
Maximum:
1.716 trl
jan 1, 2015
At the date of observation
Value
Absolute change
Change from previous value
jan 1, 1978
81.329 bln
+81.329 bln
0.0%
jan 1, 1979
94.63 bln
+13.301 bln
16.35%
jan 1, 1980
113.386 bln
+18.756 bln
19.82%
jan 1, 1981
145.135 bln
+31.749 bln
28.0%
jan 1, 1982
157.221 bln
+12.086 bln
8.33%
jan 1, 1983
146.102 bln
-11.119 bln
-7.07%
jan 1, 1984
137.38 bln
-8.722 bln
-5.97%
jan 1, 1985
131.36 bln
-6.02 bln
-4.38%
jan 1, 1986
126.4 bln
-4.96 bln
-3.78%
jan 1, 1987
116.86 bln
-9.539 bln
-7.55%
jan 1, 1988
127.846 bln
+10.985 bln
9.4%
jan 1, 1989
141.712 bln
+13.867 bln
10.85%
jan 1, 1990
155.884 bln
+14.172 bln
10.0%
jan 1, 1991
177.009 bln
+21.124 bln
13.55%
jan 1, 1992
182.301 bln
+5.292 bln
2.99%
jan 1, 1993
200.13 bln
+17.83 bln
9.78%
jan 1, 1994
217.937 bln
+17.807 bln
8.9%
jan 1, 1995
247.855 bln
+29.917 bln
13.73%
jan 1, 1996
296.26 bln
+48.405 bln
19.53%
jan 1, 1997
324.923 bln
+28.664 bln
9.68%
jan 1, 1998
352.621 bln
+27.698 bln
8.52%
jan 1, 1999
321.424 bln
-31.197 bln
-8.85%
jan 1, 2000
311.509 bln
-9.915 bln
-3.08%
jan 1, 2001
349.215 bln
+37.706 bln
12.1%
jan 1, 2002
346.669 bln
-2.546 bln
-0.73%
jan 1, 2003
361.497 bln
+14.828 bln
4.28%
jan 1, 2004
420.778 bln
+59.282 bln
16.4%
jan 1, 2005
530.025 bln
+109.246 bln
25.96%
jan 1, 2006
669.605 bln
+139.58 bln
26.33%
jan 1, 2007
783.262 bln
+113.657 bln
16.97%
jan 1, 2008
965.763 bln
+182.501 bln
23.3%
jan 1, 2009
1.259 trl
+293.179 bln
30.36%
jan 1, 2010
1.02 trl
-238.766 bln
-18.97%
jan 1, 2011
1.294 trl
+273.793 bln
26.84%
jan 1, 2012
1.605 trl
+311.318 bln
24.06%
jan 1, 2013
1.703 trl
+97.261 bln
6.06%
jan 1, 2014
1.705 trl
+2.133 bln
0.13%
jan 1, 2015
1.716 trl
+11.627 bln
0.68%
jan 1, 2016
1.556 trl
-160.485 bln
-9.35%
Ranking of countries by current statistics by years


Comments: