29
/
en
AIzaSyAYiBZKx7MnpbEhh9jyipgxe19OcubqV5w
April 1, 2024
117006
Cyprus
CYP
true
2
1
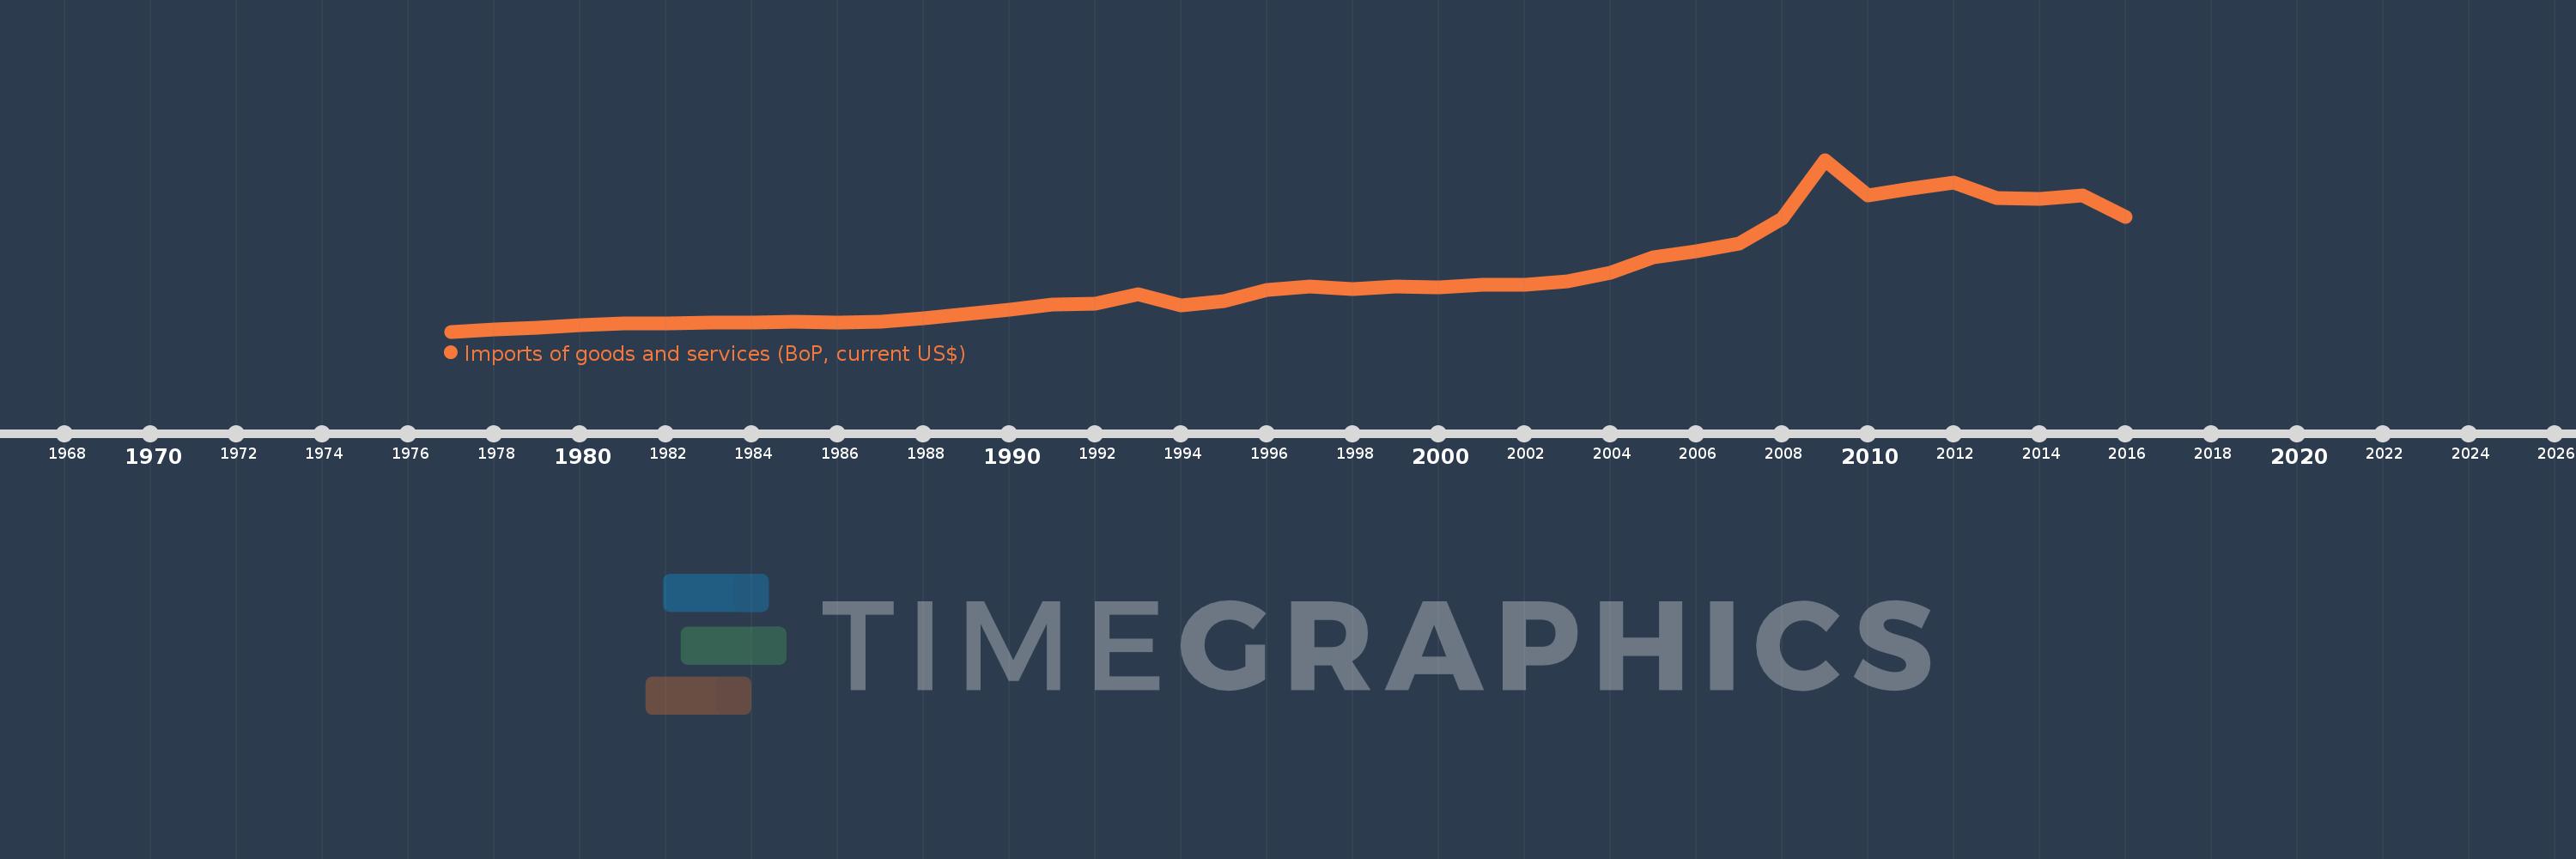
Imports of goods and services (BoP, current US$)
2016,2015,2014,2013,2012,2011,2010,2009,2008,2007,2006,2005,2004,2003,2002,2001,2000,1999,1998,1997,1996,1995,1994,1993,1992,1991,1990,1989,1988,1987,1986,1985,1984,1983,1982,1981,1980,1979,1978,1977
This statistics in other country:
AfghanistanAlbaniaAlgeriaAngolaAntigua and BarbudaArab WorldArgentinaArmeniaArubaAustraliaAustriaAzerbaijanBahamas, TheBahrainBangladeshBarbadosBelarusBelgiumBelizeBeninBermudaBhutanBoliviaBosnia and HerzegovinaBotswanaBrazilBrunei DarussalamBulgariaBurkina FasoBurundiCabo VerdeCambodiaCameroonCanadaCaribbean small statesCentral African RepublicCentral Europe and the BalticsChadChileChinaColombiaComorosCongo, Dem. Rep.Congo, Rep.Costa RicaCote d'IvoireCroatiaCuracaoCyprusCzech RepublicDenmarkDjiboutiDominicaDominican RepublicEarly-demographic dividendEast Asia & PacificEast Asia & Pacific (excluding high income)East Asia & Pacific (IDA & IBRD countries)EcuadorEgypt, Arab Rep.El SalvadorEquatorial GuineaEritreaEstoniaEthiopiaEuro areaEurope & Central AsiaEurope & Central Asia (excluding high income)Europe & Central Asia (IDA & IBRD countries)European UnionFaroe IslandsFijiFinlandFragile and conflict affected situationsFranceFrench PolynesiaGabonGambia, TheGeorgiaGermanyGhanaGreeceGrenadaGuatemalaGuineaGuinea-BissauGuyanaHaitiHeavily indebted poor countries (HIPC)High incomeHondurasHong Kong SAR, ChinaHungaryIBRD onlyIcelandIDA & IBRD totalIDA blendIDA onlyIDA totalIndiaIndonesiaIran, Islamic Rep.IraqIrelandIsraelItalyJamaicaJapanJordanKazakhstanKenyaKiribatiKorea, Rep.KosovoKuwaitKyrgyz RepublicLao PDRLate-demographic dividendLatin America & Caribbean Latin America & Caribbean (excluding high income)Latin America & the Caribbean (IDA & IBRD countries)LatviaLeast developed countries: UN classificationLebanonLesothoLiberiaLibyaLithuaniaLow & middle incomeLow incomeLower middle incomeLuxembourgMacao SAR, ChinaMacedonia, FYRMadagascarMalawiMalaysiaMaldivesMaliMaltaMarshall IslandsMauritaniaMauritiusMexicoMicronesia, Fed. Sts.Middle East & North Africa (excluding high income)Middle East & North Africa (IDA & IBRD countries)Middle incomeMoldovaMongoliaMontenegroMoroccoMozambiqueMyanmarNamibiaNepalNetherlandsNew CaledoniaNicaraguaNigerNigeriaNorth AmericaNorwayOECD membersOmanOther small statesPacific island small statesPakistanPalauPanamaPapua New GuineaParaguayPeruPhilippinesPolandPortugalPost-demographic dividendPre-demographic dividendQatarRomaniaRussian FederationRwandaSamoaSao Tome and PrincipeSaudi ArabiaSenegalSerbiaSeychellesSierra LeoneSingaporeSint Maarten (Dutch part)Slovak RepublicSloveniaSmall statesSolomon IslandsSouth AfricaSouth AsiaSouth Asia (IDA & IBRD)South SudanSpainSri LankaSt. Kitts and NevisSt. LuciaSt. Vincent and the GrenadinesSub-Saharan Africa Sub-Saharan Africa (excluding high income)Sub-Saharan Africa (IDA & IBRD countries)SudanSurinameSwazilandSwedenSwitzerlandSyrian Arab RepublicTajikistanTanzaniaThailandTimor-LesteTogoTongaTrinidad and TobagoTunisiaTurkeyTuvaluUgandaUkraineUnited KingdomUnited StatesUpper middle incomeUruguayVanuatuVenezuela, RBVietnamWest Bank and GazaWorldYemen, Rep.ZambiaZimbabwe Timeline:
This timeline shows a graph from 1977 to 2016 of Cyprus. No data until 1976. Number of actual observations by date: 40.
Source name:
World Development Indicators
Source organization:
International Monetary Fund, Balance of Payments Statistics Yearbook and data files.
Categories, topics:
Economy & Growth, Trade
Last updated:
apr 23, 2017
Indicators value changes by year
Minimum:
509.384 mln
jan 1, 1977
Maximum:
17.579 bln
jan 1, 2009
At the date of observation
Value
Absolute change
Change from previous value
jan 1, 1977
509.384 mln
+509.384 mln
0.0%
jan 1, 1978
702.487 mln
+193.103 mln
37.91%
jan 1, 1979
853.251 mln
+150.764 mln
21.46%
jan 1, 1980
1.133 bln
+279.792 mln
32.79%
jan 1, 1981
1.347 bln
+213.786 mln
18.87%
jan 1, 1982
1.316 bln
-30.598 mln
-2.27%
jan 1, 1983
1.385 bln
+68.539 mln
5.21%
jan 1, 1984
1.381 bln
-3.563 mln
-0.26%
jan 1, 1985
1.525 bln
+144.152 mln
10.44%
jan 1, 1986
1.424 bln
-101.808 mln
-6.67%
jan 1, 1987
1.503 bln
+79.315 mln
5.57%
jan 1, 1988
1.86 bln
+356.843 mln
23.74%
jan 1, 1989
2.279 bln
+419.404 mln
22.55%
jan 1, 1990
2.724 bln
+445.375 mln
19.54%
jan 1, 1991
3.178 bln
+453.778 mln
16.66%
jan 1, 1992
3.283 bln
+104.263 mln
3.28%
jan 1, 1993
4.185 bln
+902.558 mln
27.5%
jan 1, 1994
3.139 bln
-1.046 bln
-24.98%
jan 1, 1995
3.565 bln
+425.586 mln
13.56%
jan 1, 1996
4.627 bln
+1.062 bln
29.78%
jan 1, 1997
4.983 bln
+356.044 mln
7.7%
jan 1, 1998
4.719 bln
-264.194 mln
-5.3%
jan 1, 1999
4.988 bln
+269.229 mln
5.71%
jan 1, 2000
4.869 bln
-118.812 mln
-2.38%
jan 1, 2001
5.142 bln
+272.737 mln
5.6%
jan 1, 2002
5.167 bln
+25.228 mln
0.49%
jan 1, 2003
5.477 bln
+310.087 mln
6.0%
jan 1, 2004
6.345 bln
+867.356 mln
15.84%
jan 1, 2005
7.866 bln
+1.522 bln
23.98%
jan 1, 2006
8.498 bln
+631.594 mln
8.03%
jan 1, 2007
9.274 bln
+775.707 mln
9.13%
jan 1, 2008
11.721 bln
+2.447 bln
26.39%
jan 1, 2009
17.579 bln
+5.858 bln
49.98%
jan 1, 2010
14.072 bln
-3.506 bln
-19.95%
jan 1, 2011
14.703 bln
+630.276 mln
4.48%
jan 1, 2012
15.335 bln
+632.057 mln
4.3%
jan 1, 2013
13.75 bln
-1.585 bln
-10.34%
jan 1, 2014
13.704 bln
-45.768 mln
-0.33%
jan 1, 2015
14.021 bln
+316.65 mln
2.31%
jan 1, 2016
11.909 bln
-2.111 bln
-15.06%
Ranking of countries by current statistics by years


Comments: