29
/
en
AIzaSyAYiBZKx7MnpbEhh9jyipgxe19OcubqV5w
April 1, 2024
160603
Israel
ISR
true
2
1
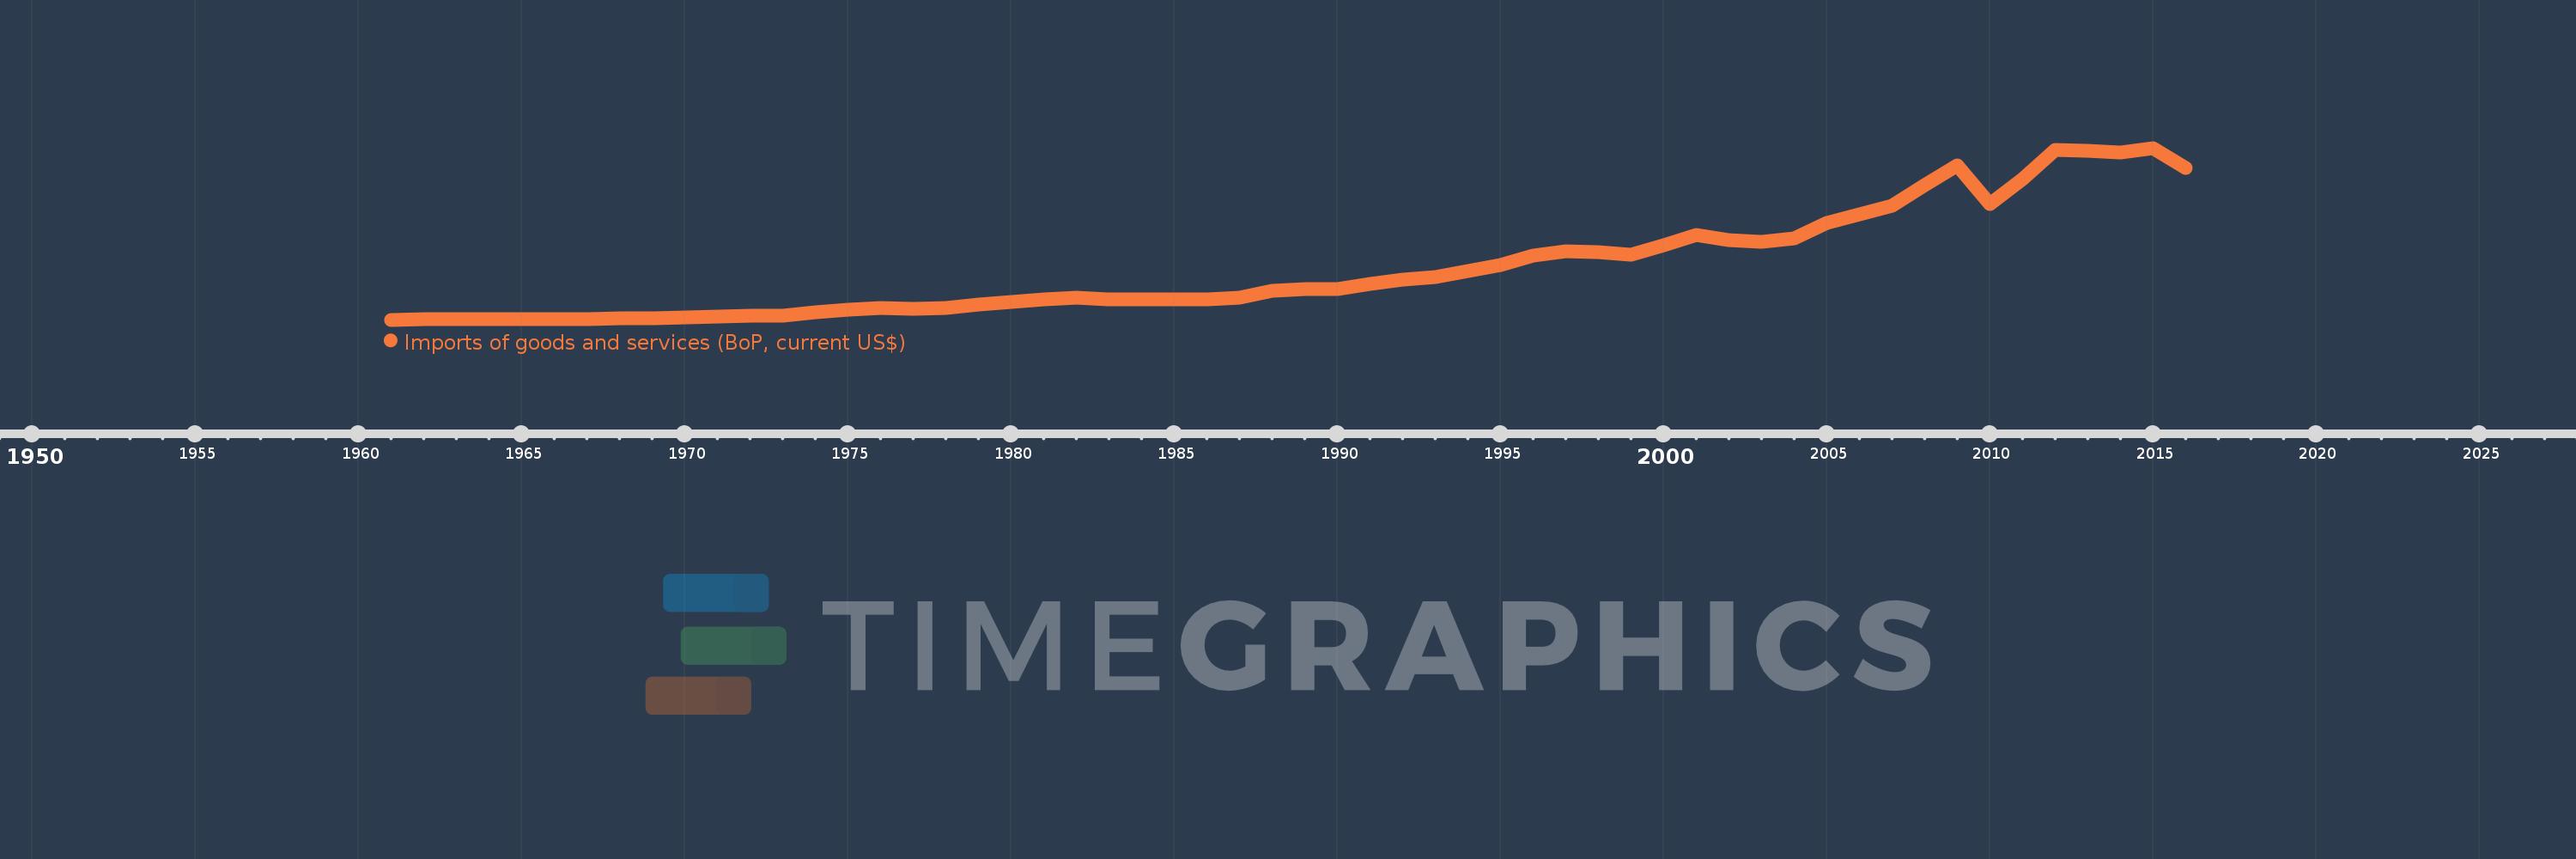
Imports of goods and services (BoP, current US$)
2016,2015,2014,2013,2012,2011,2010,2009,2008,2007,2006,2005,2004,2003,2002,2001,2000,1999,1998,1997,1996,1995,1994,1993,1992,1991,1990,1989,1988,1987,1986,1985,1984,1983,1982,1981,1980,1979,1978,1977,1976,1975,1974,1973,1972,1971,1970,1969,1968,1967,1966,1962,1961
This statistics in other country:
AfghanistanAlbaniaAlgeriaAngolaAntigua and BarbudaArab WorldArgentinaArmeniaArubaAustraliaAustriaAzerbaijanBahamas, TheBahrainBangladeshBarbadosBelarusBelgiumBelizeBeninBermudaBhutanBoliviaBosnia and HerzegovinaBotswanaBrazilBrunei DarussalamBulgariaBurkina FasoBurundiCabo VerdeCambodiaCameroonCanadaCaribbean small statesCentral African RepublicCentral Europe and the BalticsChadChileChinaColombiaComorosCongo, Dem. Rep.Congo, Rep.Costa RicaCote d'IvoireCroatiaCuracaoCyprusCzech RepublicDenmarkDjiboutiDominicaDominican RepublicEarly-demographic dividendEast Asia & PacificEast Asia & Pacific (excluding high income)East Asia & Pacific (IDA & IBRD countries)EcuadorEgypt, Arab Rep.El SalvadorEquatorial GuineaEritreaEstoniaEthiopiaEuro areaEurope & Central AsiaEurope & Central Asia (excluding high income)Europe & Central Asia (IDA & IBRD countries)European UnionFaroe IslandsFijiFinlandFragile and conflict affected situationsFranceFrench PolynesiaGabonGambia, TheGeorgiaGermanyGhanaGreeceGrenadaGuatemalaGuineaGuinea-BissauGuyanaHaitiHeavily indebted poor countries (HIPC)High incomeHondurasHong Kong SAR, ChinaHungaryIBRD onlyIcelandIDA & IBRD totalIDA blendIDA onlyIDA totalIndiaIndonesiaIran, Islamic Rep.IraqIrelandIsraelItalyJamaicaJapanJordanKazakhstanKenyaKiribatiKorea, Rep.KosovoKuwaitKyrgyz RepublicLao PDRLate-demographic dividendLatin America & Caribbean Latin America & Caribbean (excluding high income)Latin America & the Caribbean (IDA & IBRD countries)LatviaLeast developed countries: UN classificationLebanonLesothoLiberiaLibyaLithuaniaLow & middle incomeLow incomeLower middle incomeLuxembourgMacao SAR, ChinaMacedonia, FYRMadagascarMalawiMalaysiaMaldivesMaliMaltaMarshall IslandsMauritaniaMauritiusMexicoMicronesia, Fed. Sts.Middle East & North Africa (excluding high income)Middle East & North Africa (IDA & IBRD countries)Middle incomeMoldovaMongoliaMontenegroMoroccoMozambiqueMyanmarNamibiaNepalNetherlandsNew CaledoniaNicaraguaNigerNigeriaNorth AmericaNorwayOECD membersOmanOther small statesPacific island small statesPakistanPalauPanamaPapua New GuineaParaguayPeruPhilippinesPolandPortugalPost-demographic dividendPre-demographic dividendQatarRomaniaRussian FederationRwandaSamoaSao Tome and PrincipeSaudi ArabiaSenegalSerbiaSeychellesSierra LeoneSingaporeSint Maarten (Dutch part)Slovak RepublicSloveniaSmall statesSolomon IslandsSouth AfricaSouth AsiaSouth Asia (IDA & IBRD)South SudanSpainSri LankaSt. Kitts and NevisSt. LuciaSt. Vincent and the GrenadinesSub-Saharan Africa Sub-Saharan Africa (excluding high income)Sub-Saharan Africa (IDA & IBRD countries)SudanSurinameSwazilandSwedenSwitzerlandSyrian Arab RepublicTajikistanTanzaniaThailandTimor-LesteTogoTongaTrinidad and TobagoTunisiaTurkeyTuvaluUgandaUkraineUnited KingdomUnited StatesUpper middle incomeUruguayVanuatuVenezuela, RBVietnamWest Bank and GazaWorldYemen, Rep.ZambiaZimbabwe Timeline:
This timeline shows a graph from 1961 to 2016 of Israel. No data until 1960. Number of actual observations by date: 53.
Source name:
World Development Indicators
Source organization:
International Monetary Fund, Balance of Payments Statistics Yearbook and data files.
Categories, topics:
Economy & Growth, Trade
Last updated:
apr 23, 2017
Indicators value changes by year
Minimum:
613.0 mln
jan 1, 1961
Maximum:
93.813 bln
jan 1, 2015
At the date of observation
Value
Absolute change
Change from previous value
jan 1, 1961
613.0 mln
+613.0 mln
0.0%
jan 1, 1962
757.0 mln
+144.0 mln
23.49%
jan 1, 1966
1.128 bln
+371.0 mln
49.01%
jan 1, 1967
1.17 bln
+42.0 mln
3.72%
jan 1, 1968
1.317 bln
+147.0 mln
12.56%
jan 1, 1969
1.607 bln
+290.0 mln
22.02%
jan 1, 1970
1.951 bln
+344.0 mln
21.41%
jan 1, 1971
2.397 bln
+446.0 mln
22.86%
jan 1, 1972
2.856 bln
+459.0 mln
19.15%
jan 1, 1973
2.941 bln
+85.0 mln
2.98%
jan 1, 1974
4.867 bln
+1.926 bln
65.49%
jan 1, 1975
6.152 bln
+1.285 bln
26.4%
jan 1, 1976
6.798 bln
+646.0 mln
10.5%
jan 1, 1977
6.71 bln
-88.0 mln
-1.29%
jan 1, 1978
7.022 bln
+312.0 mln
4.65%
jan 1, 1979
8.665 bln
+1.643 bln
23.4%
jan 1, 1980
10.221 bln
+1.556 bln
17.96%
jan 1, 1981
11.511 bln
+1.29 bln
12.62%
jan 1, 1982
12.357 bln
+846.0 mln
7.35%
jan 1, 1983
11.573 bln
-784.4 mln
-6.35%
jan 1, 1984
11.77 bln
+197.3 mln
1.7%
jan 1, 1985
11.765 bln
-4.4 mln
-0.04%
jan 1, 1986
11.606 bln
-159.7 mln
-1.36%
jan 1, 1987
12.476 bln
+869.8 mln
7.49%
jan 1, 1988
16.408 bln
+3.932 bln
31.52%
jan 1, 1989
17.067 bln
+659.3 mln
4.02%
jan 1, 1990
17.323 bln
+256.2 mln
1.5%
jan 1, 1991
20.228 bln
+2.905 bln
16.77%
jan 1, 1992
22.271 bln
+2.043 bln
10.1%
jan 1, 1993
23.934 bln
+1.663 bln
7.46%
jan 1, 1994
26.93 bln
+2.996 bln
12.52%
jan 1, 1995
30.317 bln
+3.387 bln
12.58%
jan 1, 1996
35.287 bln
+4.969 bln
16.39%
jan 1, 1997
37.552 bln
+2.265 bln
6.42%
jan 1, 1998
37.157 bln
-395.0 mln
-1.05%
jan 1, 1999
35.872 bln
-1.284 bln
-3.46%
jan 1, 2000
40.826 bln
+4.953 bln
13.81%
jan 1, 2001
46.796 bln
+5.97 bln
14.62%
jan 1, 2002
43.647 bln
-3.149 bln
-6.73%
jan 1, 2003
42.827 bln
-819.1 mln
-1.88%
jan 1, 2004
44.519 bln
+1.691 bln
3.95%
jan 1, 2005
52.905 bln
+8.387 bln
18.84%
jan 1, 2006
57.713 bln
+4.808 bln
9.09%
jan 1, 2007
62.441 bln
+4.727 bln
8.19%
jan 1, 2008
73.715 bln
+11.275 bln
18.06%
jan 1, 2009
84.285 bln
+10.57 bln
14.34%
jan 1, 2010
63.512 bln
-20.773 bln
-24.65%
jan 1, 2011
76.987 bln
+13.475 bln
21.22%
jan 1, 2012
92.767 bln
+15.78 bln
20.5%
jan 1, 2013
92.441 bln
-326.2 mln
-0.35%
jan 1, 2014
91.242 bln
-1.199 bln
-1.3%
jan 1, 2015
93.813 bln
+2.571 bln
2.82%
jan 1, 2016
82.88 bln
-10.934 bln
-11.65%
Ranking of countries by current statistics by years


Comments: