29
/
en
AIzaSyAYiBZKx7MnpbEhh9jyipgxe19OcubqV5w
April 1, 2024
28212
East Asia & Pacific (excluding high income)
EAP
false
2
1
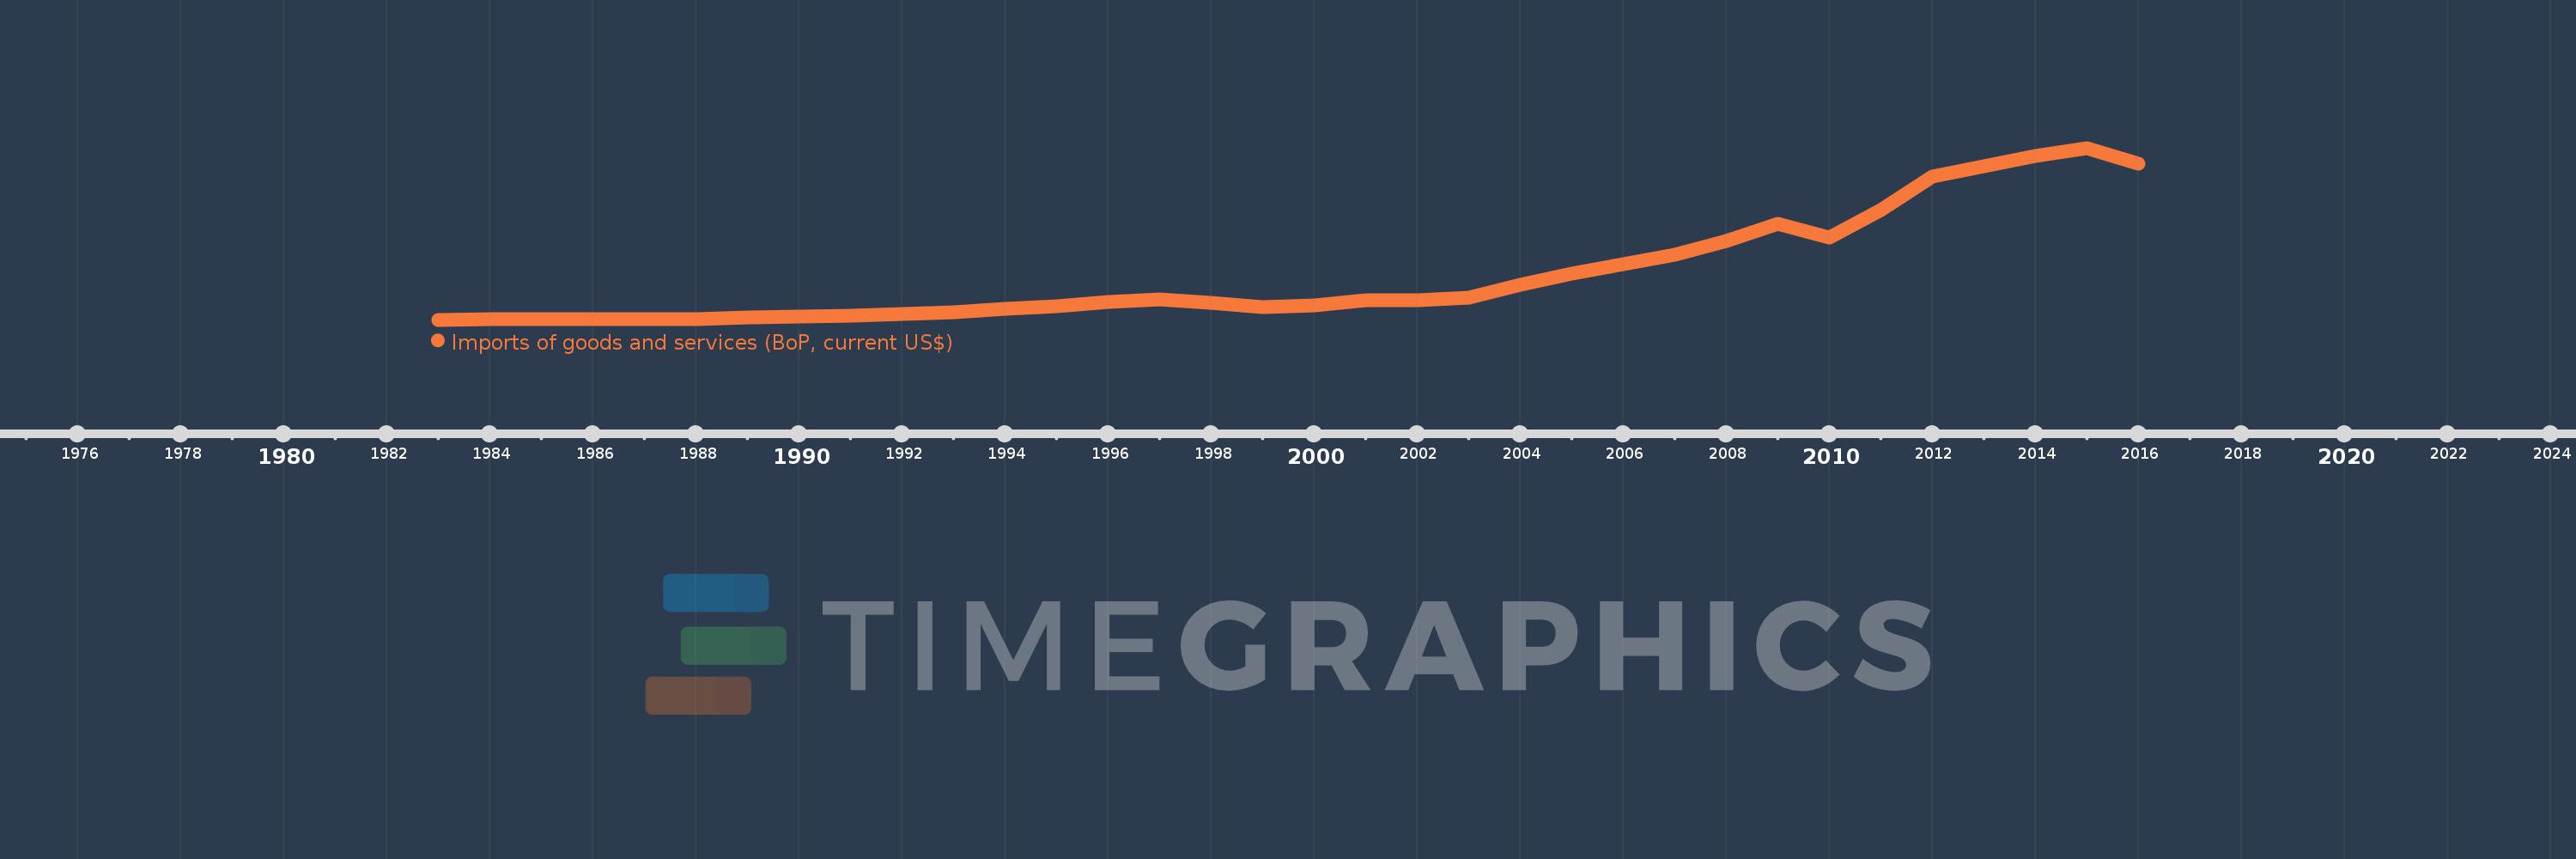
Imports of goods and services (BoP, current US$)
2016,2015,2014,2013,2012,2011,2010,2009,2008,2007,2006,2005,2004,2003,2002,2001,2000,1999,1998,1997,1996,1995,1994,1993,1992,1991,1990,1989,1988,1987,1986,1985,1984,1983
This statistics in other country:
AfghanistanAlbaniaAlgeriaAngolaAntigua and BarbudaArab WorldArgentinaArmeniaArubaAustraliaAustriaAzerbaijanBahamas, TheBahrainBangladeshBarbadosBelarusBelgiumBelizeBeninBermudaBhutanBoliviaBosnia and HerzegovinaBotswanaBrazilBrunei DarussalamBulgariaBurkina FasoBurundiCabo VerdeCambodiaCameroonCanadaCaribbean small statesCentral African RepublicCentral Europe and the BalticsChadChileChinaColombiaComorosCongo, Dem. Rep.Congo, Rep.Costa RicaCote d'IvoireCroatiaCuracaoCyprusCzech RepublicDenmarkDjiboutiDominicaDominican RepublicEarly-demographic dividendEast Asia & PacificEast Asia & Pacific (excluding high income)East Asia & Pacific (IDA & IBRD countries)EcuadorEgypt, Arab Rep.El SalvadorEquatorial GuineaEritreaEstoniaEthiopiaEuro areaEurope & Central AsiaEurope & Central Asia (excluding high income)Europe & Central Asia (IDA & IBRD countries)European UnionFaroe IslandsFijiFinlandFragile and conflict affected situationsFranceFrench PolynesiaGabonGambia, TheGeorgiaGermanyGhanaGreeceGrenadaGuatemalaGuineaGuinea-BissauGuyanaHaitiHeavily indebted poor countries (HIPC)High incomeHondurasHong Kong SAR, ChinaHungaryIBRD onlyIcelandIDA & IBRD totalIDA blendIDA onlyIDA totalIndiaIndonesiaIran, Islamic Rep.IraqIrelandIsraelItalyJamaicaJapanJordanKazakhstanKenyaKiribatiKorea, Rep.KosovoKuwaitKyrgyz RepublicLao PDRLate-demographic dividendLatin America & Caribbean Latin America & Caribbean (excluding high income)Latin America & the Caribbean (IDA & IBRD countries)LatviaLeast developed countries: UN classificationLebanonLesothoLiberiaLibyaLithuaniaLow & middle incomeLow incomeLower middle incomeLuxembourgMacao SAR, ChinaMacedonia, FYRMadagascarMalawiMalaysiaMaldivesMaliMaltaMarshall IslandsMauritaniaMauritiusMexicoMicronesia, Fed. Sts.Middle East & North Africa (excluding high income)Middle East & North Africa (IDA & IBRD countries)Middle incomeMoldovaMongoliaMontenegroMoroccoMozambiqueMyanmarNamibiaNepalNetherlandsNew CaledoniaNicaraguaNigerNigeriaNorth AmericaNorwayOECD membersOmanOther small statesPacific island small statesPakistanPalauPanamaPapua New GuineaParaguayPeruPhilippinesPolandPortugalPost-demographic dividendPre-demographic dividendQatarRomaniaRussian FederationRwandaSamoaSao Tome and PrincipeSaudi ArabiaSenegalSerbiaSeychellesSierra LeoneSingaporeSint Maarten (Dutch part)Slovak RepublicSloveniaSmall statesSolomon IslandsSouth AfricaSouth AsiaSouth Asia (IDA & IBRD)South SudanSpainSri LankaSt. Kitts and NevisSt. LuciaSt. Vincent and the GrenadinesSub-Saharan Africa Sub-Saharan Africa (excluding high income)Sub-Saharan Africa (IDA & IBRD countries)SudanSurinameSwazilandSwedenSwitzerlandSyrian Arab RepublicTajikistanTanzaniaThailandTimor-LesteTogoTongaTrinidad and TobagoTunisiaTurkeyTuvaluUgandaUkraineUnited KingdomUnited StatesUpper middle incomeUruguayVanuatuVenezuela, RBVietnamWest Bank and GazaWorldYemen, Rep.ZambiaZimbabwe Timeline:
This timeline shows a graph from 1983 to 2016 of East Asia & Pacific (excluding high income). No data until 1982. Number of actual observations by date: 34.
Source name:
World Development Indicators
Source organization:
International Monetary Fund, Balance of Payments Statistics Yearbook and data files.
Categories, topics:
Economy & Growth, Trade
Last updated:
apr 23, 2017
Indicators value changes by year
Minimum:
83.949 bln
jan 1, 1983
Maximum:
3.235 trl
jan 1, 2015
At the date of observation
Value
Absolute change
Change from previous value
jan 1, 1983
83.949 bln
+83.949 bln
0.0%
jan 1, 1984
87.746 bln
+3.796 bln
4.52%
jan 1, 1985
89.495 bln
+1.749 bln
1.99%
jan 1, 1986
97.724 bln
+8.229 bln
9.19%
jan 1, 1987
91.303 bln
-6.421 bln
-6.57%
jan 1, 1988
102.104 bln
+10.801 bln
11.83%
jan 1, 1989
128.488 bln
+26.385 bln
25.84%
jan 1, 1990
149.232 bln
+20.744 bln
16.14%
jan 1, 1991
165.868 bln
+16.635 bln
11.15%
jan 1, 1992
192.217 bln
+26.35 bln
15.89%
jan 1, 1993
228.184 bln
+35.967 bln
18.71%
jan 1, 1994
277.641 bln
+49.457 bln
21.67%
jan 1, 1995
329.121 bln
+51.479 bln
18.54%
jan 1, 1996
412.643 bln
+83.522 bln
25.38%
jan 1, 1997
451.307 bln
+38.664 bln
9.37%
jan 1, 1998
399.729 bln
-51.579 bln
-11.43%
jan 1, 1999
320.352 bln
-79.377 bln
-19.86%
jan 1, 2000
349.247 bln
+28.895 bln
9.02%
jan 1, 2001
446.36 bln
+97.113 bln
27.81%
jan 1, 2002
447.792 bln
+1.432 bln
0.32%
jan 1, 2003
495.212 bln
+47.42 bln
10.59%
jan 1, 2004
725.578 bln
+230.366 bln
46.52%
jan 1, 2005
935.982 bln
+210.404 bln
29.0%
jan 1, 2006
1.099 trl
+163.011 bln
17.42%
jan 1, 2007
1.282 trl
+183.012 bln
16.65%
jan 1, 2008
1.524 trl
+242.301 bln
18.9%
jan 1, 2009
1.842 trl
+317.594 bln
20.84%
jan 1, 2010
1.585 trl
-257.244 bln
-13.97%
jan 1, 2011
2.102 trl
+516.927 bln
32.62%
jan 1, 2012
2.706 trl
+604.339 bln
28.76%
jan 1, 2013
2.893 trl
+187.229 bln
6.92%
jan 1, 2014
3.096 trl
+202.5 bln
7.0%
jan 1, 2015
3.235 trl
+139.098 bln
4.49%
jan 1, 2016
2.942 trl
-292.505 bln
-9.04%
Ranking of countries by current statistics by years


Comments: