29
/
en
AIzaSyAYiBZKx7MnpbEhh9jyipgxe19OcubqV5w
April 1, 2024
265875
Tonga
TON
true
2
1
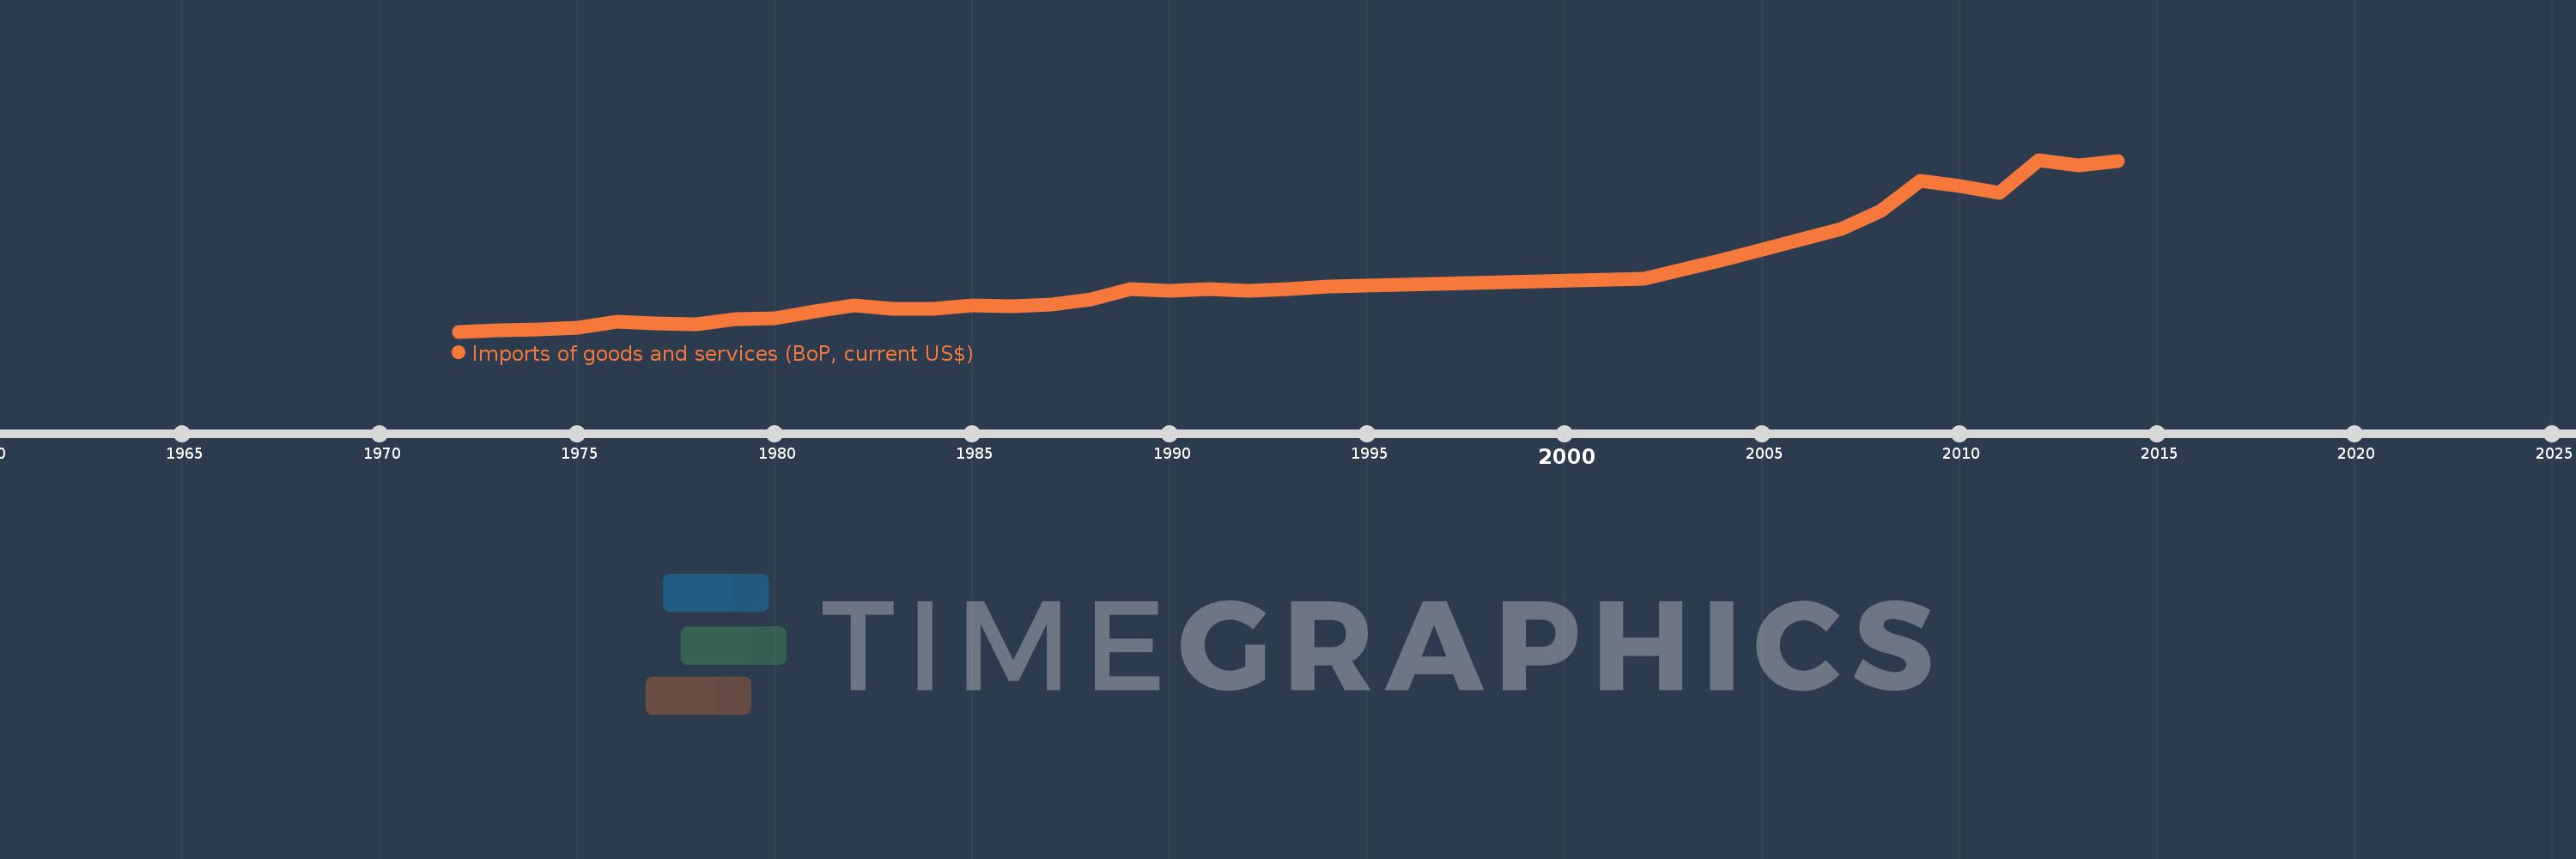
Imports of goods and services (BoP, current US$)
2014,2013,2012,2011,2010,2009,2008,2007,2006,2005,2004,2003,2002,1994,1993,1992,1991,1990,1989,1988,1987,1986,1985,1984,1983,1982,1981,1980,1979,1978,1977,1976,1975,1974,1973,1972
This statistics in other country:
AfghanistanAlbaniaAlgeriaAngolaAntigua and BarbudaArab WorldArgentinaArmeniaArubaAustraliaAustriaAzerbaijanBahamas, TheBahrainBangladeshBarbadosBelarusBelgiumBelizeBeninBermudaBhutanBoliviaBosnia and HerzegovinaBotswanaBrazilBrunei DarussalamBulgariaBurkina FasoBurundiCabo VerdeCambodiaCameroonCanadaCaribbean small statesCentral African RepublicCentral Europe and the BalticsChadChileChinaColombiaComorosCongo, Dem. Rep.Congo, Rep.Costa RicaCote d'IvoireCroatiaCuracaoCyprusCzech RepublicDenmarkDjiboutiDominicaDominican RepublicEarly-demographic dividendEast Asia & PacificEast Asia & Pacific (excluding high income)East Asia & Pacific (IDA & IBRD countries)EcuadorEgypt, Arab Rep.El SalvadorEquatorial GuineaEritreaEstoniaEthiopiaEuro areaEurope & Central AsiaEurope & Central Asia (excluding high income)Europe & Central Asia (IDA & IBRD countries)European UnionFaroe IslandsFijiFinlandFragile and conflict affected situationsFranceFrench PolynesiaGabonGambia, TheGeorgiaGermanyGhanaGreeceGrenadaGuatemalaGuineaGuinea-BissauGuyanaHaitiHeavily indebted poor countries (HIPC)High incomeHondurasHong Kong SAR, ChinaHungaryIBRD onlyIcelandIDA & IBRD totalIDA blendIDA onlyIDA totalIndiaIndonesiaIran, Islamic Rep.IraqIrelandIsraelItalyJamaicaJapanJordanKazakhstanKenyaKiribatiKorea, Rep.KosovoKuwaitKyrgyz RepublicLao PDRLate-demographic dividendLatin America & Caribbean Latin America & Caribbean (excluding high income)Latin America & the Caribbean (IDA & IBRD countries)LatviaLeast developed countries: UN classificationLebanonLesothoLiberiaLibyaLithuaniaLow & middle incomeLow incomeLower middle incomeLuxembourgMacao SAR, ChinaMacedonia, FYRMadagascarMalawiMalaysiaMaldivesMaliMaltaMarshall IslandsMauritaniaMauritiusMexicoMicronesia, Fed. Sts.Middle East & North Africa (excluding high income)Middle East & North Africa (IDA & IBRD countries)Middle incomeMoldovaMongoliaMontenegroMoroccoMozambiqueMyanmarNamibiaNepalNetherlandsNew CaledoniaNicaraguaNigerNigeriaNorth AmericaNorwayOECD membersOmanOther small statesPacific island small statesPakistanPalauPanamaPapua New GuineaParaguayPeruPhilippinesPolandPortugalPost-demographic dividendPre-demographic dividendQatarRomaniaRussian FederationRwandaSamoaSao Tome and PrincipeSaudi ArabiaSenegalSerbiaSeychellesSierra LeoneSingaporeSint Maarten (Dutch part)Slovak RepublicSloveniaSmall statesSolomon IslandsSouth AfricaSouth AsiaSouth Asia (IDA & IBRD)South SudanSpainSri LankaSt. Kitts and NevisSt. LuciaSt. Vincent and the GrenadinesSub-Saharan Africa Sub-Saharan Africa (excluding high income)Sub-Saharan Africa (IDA & IBRD countries)SudanSurinameSwazilandSwedenSwitzerlandSyrian Arab RepublicTajikistanTanzaniaThailandTimor-LesteTogoTongaTrinidad and TobagoTunisiaTurkeyTuvaluUgandaUkraineUnited KingdomUnited StatesUpper middle incomeUruguayVanuatuVenezuela, RBVietnamWest Bank and GazaWorldYemen, Rep.ZambiaZimbabwe Timeline:
This timeline shows a graph from 1972 to 2014 of Tonga. No data until 1971. Number of actual observations by date: 36.
Source name:
World Development Indicators
Source organization:
International Monetary Fund, Balance of Payments Statistics Yearbook and data files.
Categories, topics:
Economy & Growth, Trade
Last updated:
apr 23, 2017
Indicators value changes by year
Minimum:
6.15 mln
jan 1, 1972
Maximum:
281.213 mln
jan 1, 2012
At the date of observation
Value
Absolute change
Change from previous value
jan 1, 1972
6.15 mln
+6.15 mln
0.0%
jan 1, 1973
8.223 mln
+2.072 mln
33.7%
jan 1, 1974
9.736 mln
+1.513 mln
18.4%
jan 1, 1975
12.727 mln
+2.991 mln
30.73%
jan 1, 1976
22.228 mln
+9.501 mln
74.65%
jan 1, 1977
18.624 mln
-3.604 mln
-16.22%
jan 1, 1978
18.504 mln
-119.635K
-0.64%
jan 1, 1979
26.247 mln
+7.743 mln
41.84%
jan 1, 1980
27.46 mln
+1.213 mln
4.62%
jan 1, 1981
39.069 mln
+11.609 mln
42.28%
jan 1, 1982
47.571 mln
+8.502 mln
21.76%
jan 1, 1983
43.091 mln
-4.481 mln
-9.42%
jan 1, 1984
43.049 mln
-41.8K
-0.1%
jan 1, 1985
47.77 mln
+4.722 mln
10.97%
jan 1, 1986
46.08 mln
-1.691 mln
-3.54%
jan 1, 1987
49.203 mln
+3.124 mln
6.78%
jan 1, 1988
57.289 mln
+8.086 mln
16.43%
jan 1, 1989
74.322 mln
+17.033 mln
29.73%
jan 1, 1990
70.792 mln
-3.53 mln
-4.75%
jan 1, 1991
74.138 mln
+3.347 mln
4.73%
jan 1, 1992
71.894 mln
-2.245 mln
-3.03%
jan 1, 1993
73.544 mln
+1.65 mln
2.3%
jan 1, 1994
77.75 mln
+4.206 mln
5.72%
jan 1, 2002
91.244 mln
+13.494 mln
17.36%
jan 1, 2003
105.31 mln
+14.066 mln
15.42%
jan 1, 2004
121.5 mln
+16.19 mln
15.37%
jan 1, 2005
137.696 mln
+16.196 mln
13.33%
jan 1, 2006
154.538 mln
+16.843 mln
12.23%
jan 1, 2007
170.447 mln
+15.909 mln
10.29%
jan 1, 2008
199.362 mln
+28.915 mln
16.96%
jan 1, 2009
247.493 mln
+48.132 mln
24.14%
jan 1, 2010
239.232 mln
-8.262 mln
-3.34%
jan 1, 2011
228.434 mln
-10.798 mln
-4.51%
jan 1, 2012
281.213 mln
+52.78 mln
23.11%
jan 1, 2013
271.725 mln
-9.488 mln
-3.37%
jan 1, 2014
278.505 mln
+6.78 mln
2.5%
Ranking of countries by current statistics by years


Comments: