29
/
en
AIzaSyAYiBZKx7MnpbEhh9jyipgxe19OcubqV5w
April 1, 2024
78373
Bangladesh
BGD
true
2
1
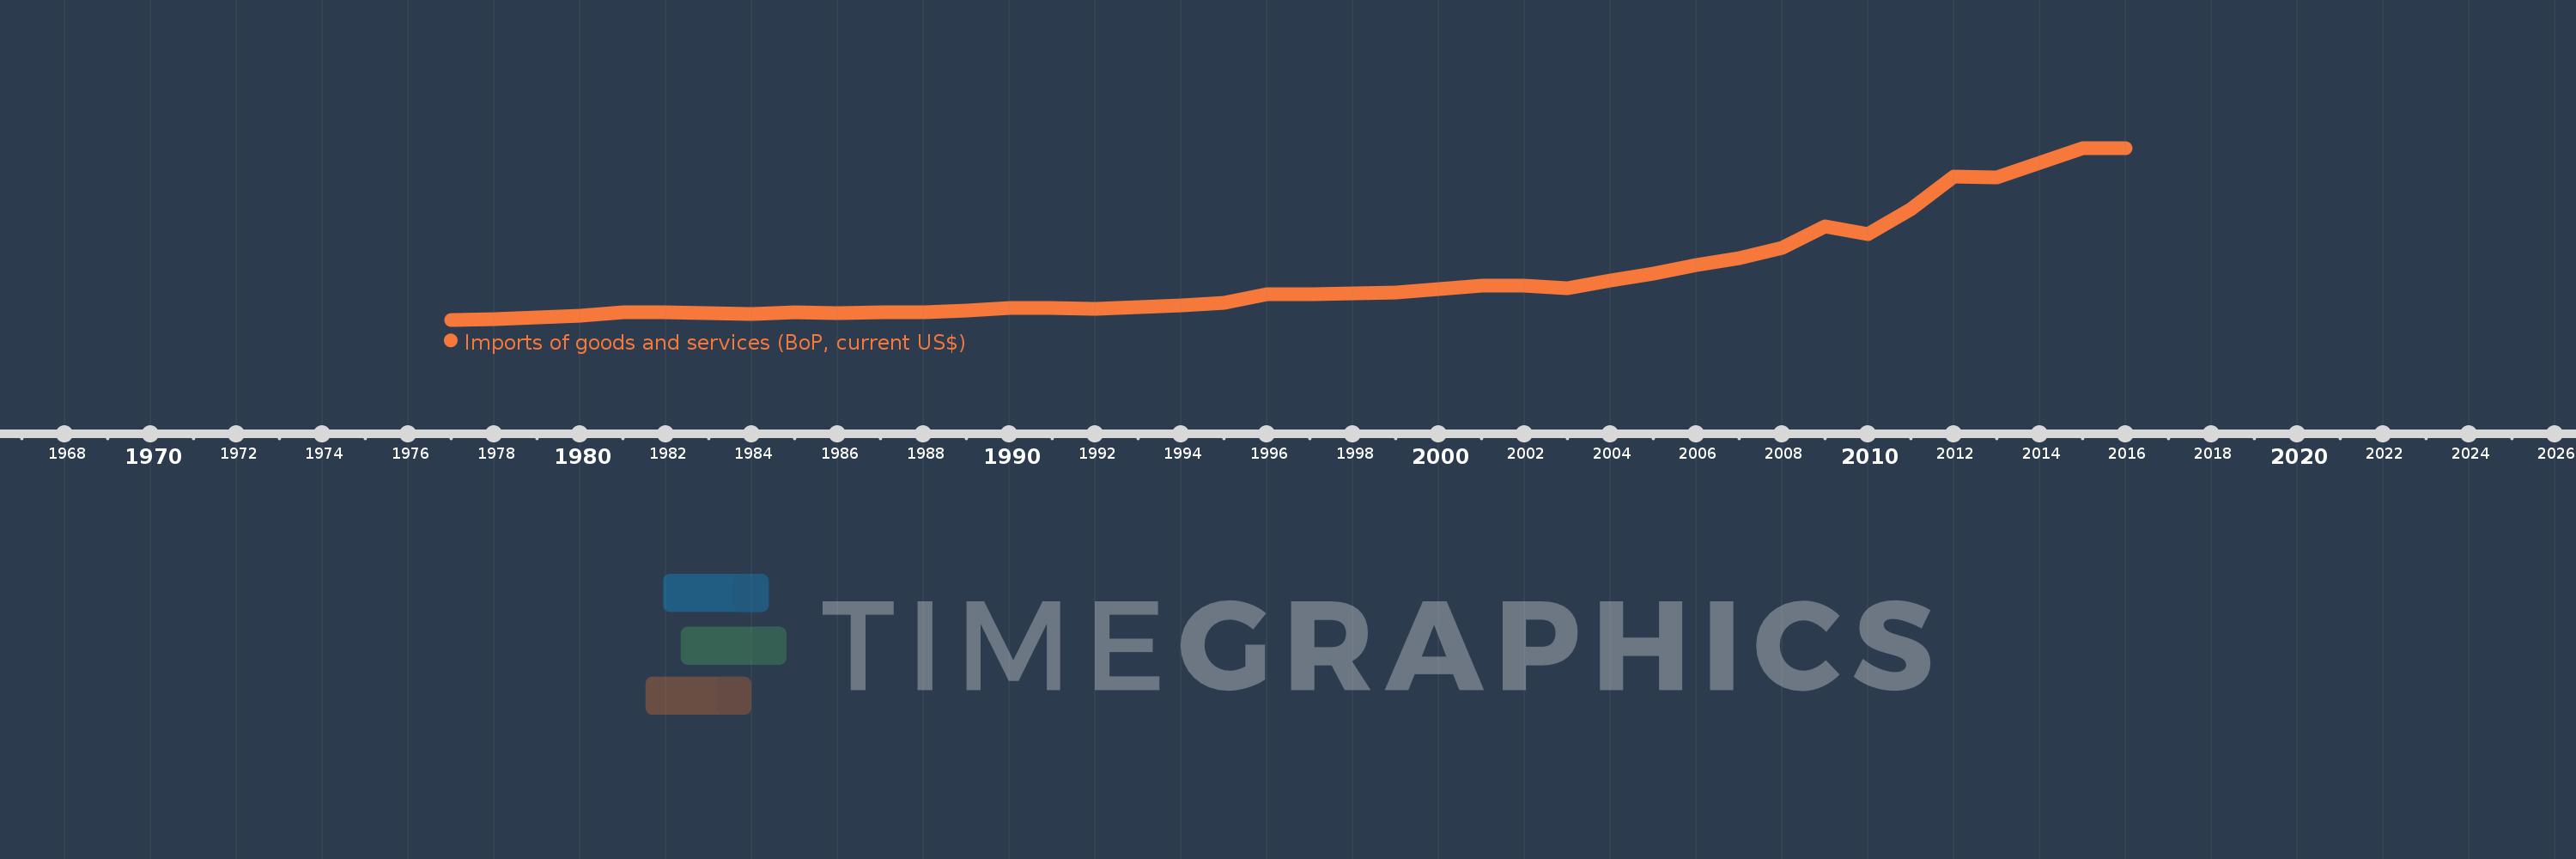
Imports of goods and services (BoP, current US$)
2016,2015,2014,2013,2012,2011,2010,2009,2008,2007,2006,2005,2004,2003,2002,2001,2000,1999,1998,1997,1996,1995,1994,1993,1992,1991,1990,1989,1988,1987,1986,1985,1984,1983,1982,1981,1980,1979,1978,1977
This statistics in other country:
AfghanistanAlbaniaAlgeriaAngolaAntigua and BarbudaArab WorldArgentinaArmeniaArubaAustraliaAustriaAzerbaijanBahamas, TheBahrainBangladeshBarbadosBelarusBelgiumBelizeBeninBermudaBhutanBoliviaBosnia and HerzegovinaBotswanaBrazilBrunei DarussalamBulgariaBurkina FasoBurundiCabo VerdeCambodiaCameroonCanadaCaribbean small statesCentral African RepublicCentral Europe and the BalticsChadChileChinaColombiaComorosCongo, Dem. Rep.Congo, Rep.Costa RicaCote d'IvoireCroatiaCuracaoCyprusCzech RepublicDenmarkDjiboutiDominicaDominican RepublicEarly-demographic dividendEast Asia & PacificEast Asia & Pacific (excluding high income)East Asia & Pacific (IDA & IBRD countries)EcuadorEgypt, Arab Rep.El SalvadorEquatorial GuineaEritreaEstoniaEthiopiaEuro areaEurope & Central AsiaEurope & Central Asia (excluding high income)Europe & Central Asia (IDA & IBRD countries)European UnionFaroe IslandsFijiFinlandFragile and conflict affected situationsFranceFrench PolynesiaGabonGambia, TheGeorgiaGermanyGhanaGreeceGrenadaGuatemalaGuineaGuinea-BissauGuyanaHaitiHeavily indebted poor countries (HIPC)High incomeHondurasHong Kong SAR, ChinaHungaryIBRD onlyIcelandIDA & IBRD totalIDA blendIDA onlyIDA totalIndiaIndonesiaIran, Islamic Rep.IraqIrelandIsraelItalyJamaicaJapanJordanKazakhstanKenyaKiribatiKorea, Rep.KosovoKuwaitKyrgyz RepublicLao PDRLate-demographic dividendLatin America & Caribbean Latin America & Caribbean (excluding high income)Latin America & the Caribbean (IDA & IBRD countries)LatviaLeast developed countries: UN classificationLebanonLesothoLiberiaLibyaLithuaniaLow & middle incomeLow incomeLower middle incomeLuxembourgMacao SAR, ChinaMacedonia, FYRMadagascarMalawiMalaysiaMaldivesMaliMaltaMarshall IslandsMauritaniaMauritiusMexicoMicronesia, Fed. Sts.Middle East & North Africa (excluding high income)Middle East & North Africa (IDA & IBRD countries)Middle incomeMoldovaMongoliaMontenegroMoroccoMozambiqueMyanmarNamibiaNepalNetherlandsNew CaledoniaNicaraguaNigerNigeriaNorth AmericaNorwayOECD membersOmanOther small statesPacific island small statesPakistanPalauPanamaPapua New GuineaParaguayPeruPhilippinesPolandPortugalPost-demographic dividendPre-demographic dividendQatarRomaniaRussian FederationRwandaSamoaSao Tome and PrincipeSaudi ArabiaSenegalSerbiaSeychellesSierra LeoneSingaporeSint Maarten (Dutch part)Slovak RepublicSloveniaSmall statesSolomon IslandsSouth AfricaSouth AsiaSouth Asia (IDA & IBRD)South SudanSpainSri LankaSt. Kitts and NevisSt. LuciaSt. Vincent and the GrenadinesSub-Saharan Africa Sub-Saharan Africa (excluding high income)Sub-Saharan Africa (IDA & IBRD countries)SudanSurinameSwazilandSwedenSwitzerlandSyrian Arab RepublicTajikistanTanzaniaThailandTimor-LesteTogoTongaTrinidad and TobagoTunisiaTurkeyTuvaluUgandaUkraineUnited KingdomUnited StatesUpper middle incomeUruguayVanuatuVenezuela, RBVietnamWest Bank and GazaWorldYemen, Rep.ZambiaZimbabwe Timeline:
This timeline shows a graph from 1977 to 2016 of Bangladesh. No data until 1976. Number of actual observations by date: 40.
Source name:
World Development Indicators
Source organization:
International Monetary Fund, Balance of Payments Statistics Yearbook and data files.
Categories, topics:
Economy & Growth, Trade
Last updated:
apr 23, 2017
Indicators value changes by year
Minimum:
947.869 mln
jan 1, 1977
Maximum:
45.326 bln
jan 1, 2016
At the date of observation
Value
Absolute change
Change from previous value
jan 1, 1977
947.869 mln
+947.869 mln
0.0%
jan 1, 1978
1.204 bln
+256.079 mln
27.02%
jan 1, 1979
1.593 bln
+388.795 mln
32.29%
jan 1, 1980
2.098 bln
+505.238 mln
31.72%
jan 1, 1981
2.834 bln
+736.034 mln
35.08%
jan 1, 1982
2.898 bln
+64.241 mln
2.27%
jan 1, 1983
2.661 bln
-237.439 mln
-8.19%
jan 1, 1984
2.336 bln
-325.024 mln
-12.22%
jan 1, 1985
2.818 bln
+482.225 mln
20.65%
jan 1, 1986
2.764 bln
-53.646 mln
-1.9%
jan 1, 1987
2.804 bln
+39.355 mln
1.42%
jan 1, 1988
2.94 bln
+136.094 mln
4.85%
jan 1, 1989
3.348 bln
+407.709 mln
13.87%
jan 1, 1990
4.026 bln
+678.965 mln
20.28%
jan 1, 1991
3.96 bln
-66.684 mln
-1.66%
jan 1, 1992
3.77 bln
-190.08 mln
-4.8%
jan 1, 1993
4.143 bln
+372.838 mln
9.89%
jan 1, 1994
4.589 bln
+446.856 mln
10.79%
jan 1, 1995
5.376 bln
+786.132 mln
17.13%
jan 1, 1996
7.589 bln
+2.213 bln
41.17%
jan 1, 1997
7.451 bln
-137.957 mln
-1.82%
jan 1, 1998
7.834 bln
+383.782 mln
5.15%
jan 1, 1999
7.953 bln
+118.39 mln
1.51%
jan 1, 2000
8.932 bln
+979.425 mln
12.32%
jan 1, 2001
9.673 bln
+740.897 mln
8.29%
jan 1, 2002
9.655 bln
-18.219 mln
-0.19%
jan 1, 2003
9.12 bln
-535.052 mln
-5.54%
jan 1, 2004
11.07 bln
+1.95 bln
21.38%
jan 1, 2005
12.972 bln
+1.902 bln
17.19%
jan 1, 2006
15.055 bln
+2.083 bln
16.06%
jan 1, 2007
16.784 bln
+1.728 bln
11.48%
jan 1, 2008
19.553 bln
+2.769 bln
16.5%
jan 1, 2009
25.168 bln
+5.614 bln
28.71%
jan 1, 2010
23.073 bln
-2.095 bln
-8.32%
jan 1, 2011
29.471 bln
+6.398 bln
27.73%
jan 1, 2012
37.878 bln
+8.407 bln
28.53%
jan 1, 2013
37.749 bln
-129.16 mln
-0.34%
jan 1, 2014
41.568 bln
+3.819 bln
10.12%
jan 1, 2015
45.177 bln
+3.608 bln
8.68%
jan 1, 2016
45.326 bln
+149.65 mln
0.33%
Ranking of countries by current statistics by years


Comments: