29
/
en
AIzaSyAYiBZKx7MnpbEhh9jyipgxe19OcubqV5w
April 1, 2024
134226
France
FRA
true
2
1
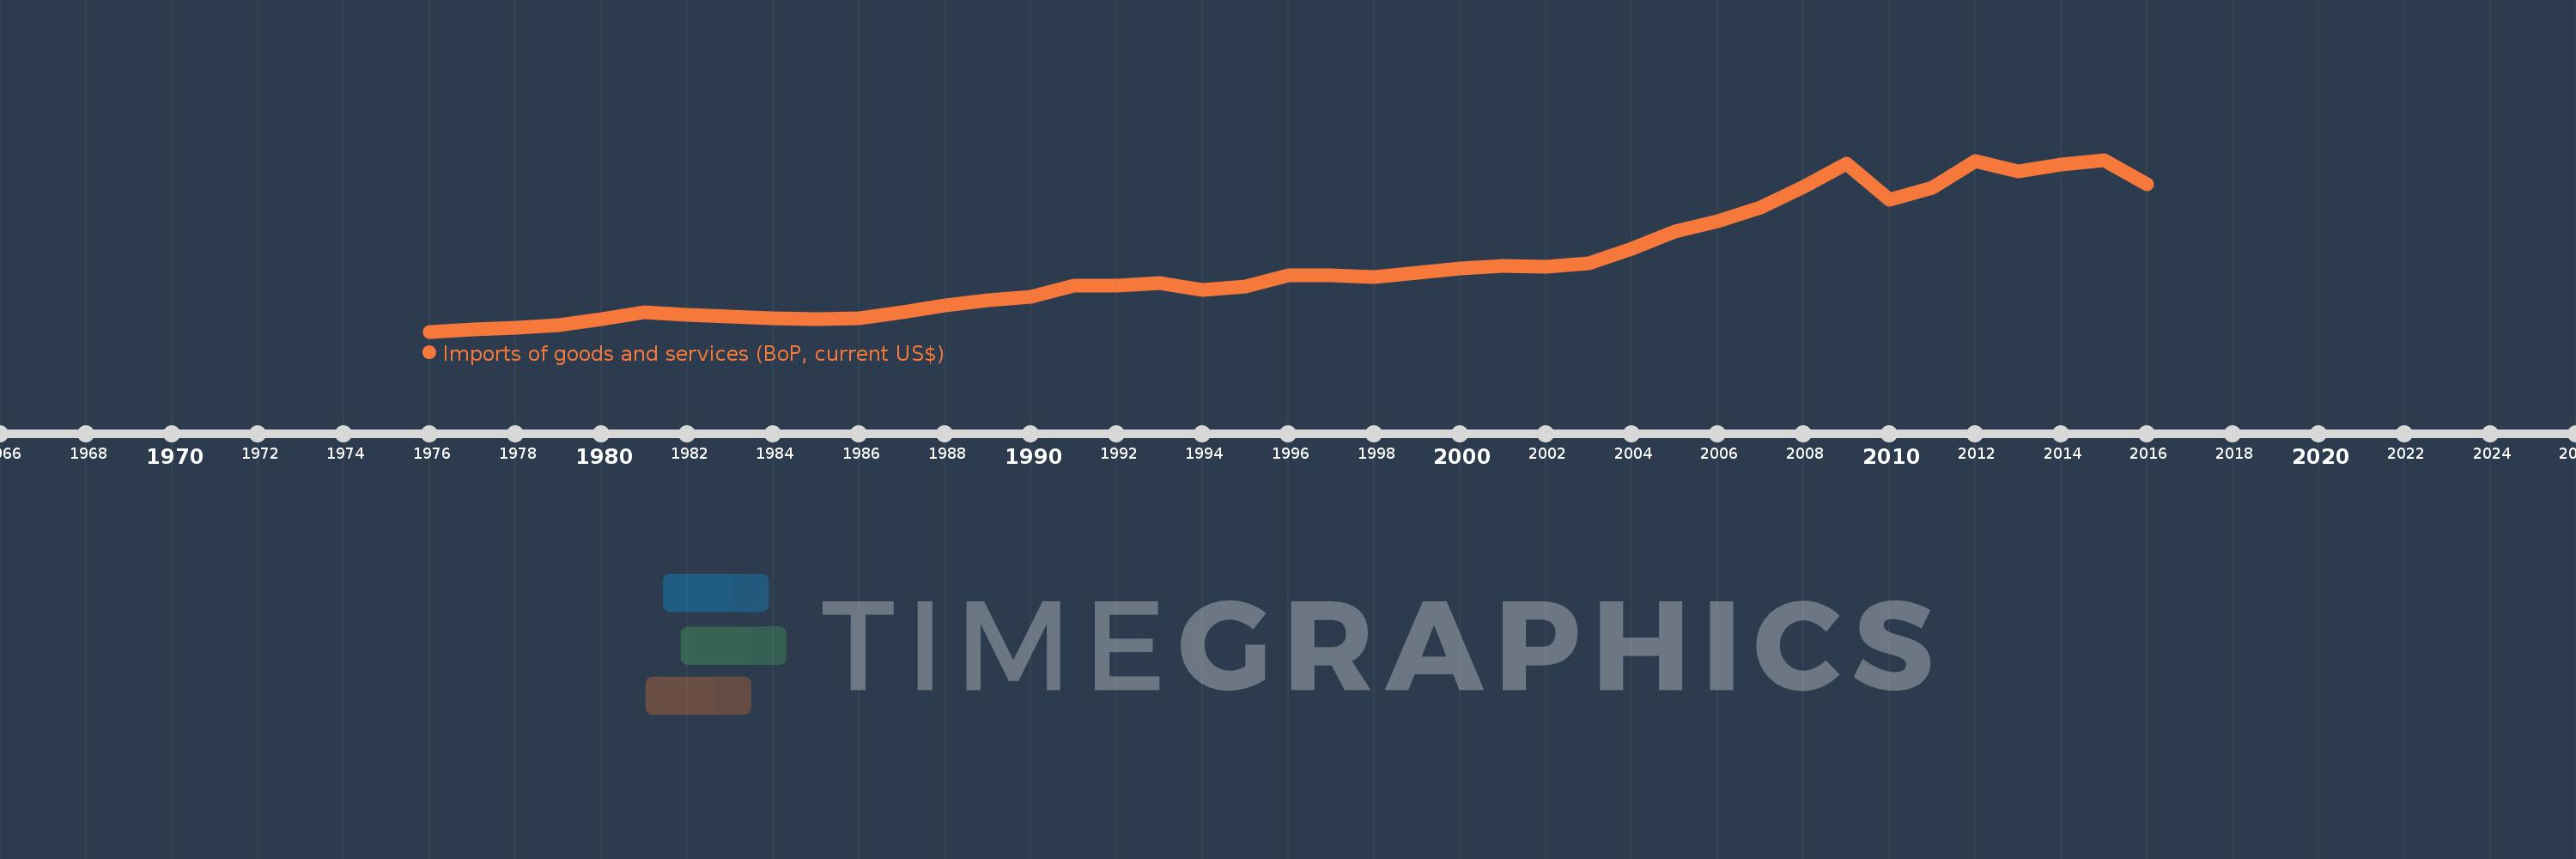
Imports of goods and services (BoP, current US$)
2016,2015,2014,2013,2012,2011,2010,2009,2008,2007,2006,2005,2004,2003,2002,2001,2000,1999,1998,1997,1996,1995,1994,1993,1992,1991,1990,1989,1988,1987,1986,1985,1984,1983,1982,1981,1980,1979,1978,1977,1976
This statistics in other country:
AfghanistanAlbaniaAlgeriaAngolaAntigua and BarbudaArab WorldArgentinaArmeniaArubaAustraliaAustriaAzerbaijanBahamas, TheBahrainBangladeshBarbadosBelarusBelgiumBelizeBeninBermudaBhutanBoliviaBosnia and HerzegovinaBotswanaBrazilBrunei DarussalamBulgariaBurkina FasoBurundiCabo VerdeCambodiaCameroonCanadaCaribbean small statesCentral African RepublicCentral Europe and the BalticsChadChileChinaColombiaComorosCongo, Dem. Rep.Congo, Rep.Costa RicaCote d'IvoireCroatiaCuracaoCyprusCzech RepublicDenmarkDjiboutiDominicaDominican RepublicEarly-demographic dividendEast Asia & PacificEast Asia & Pacific (excluding high income)East Asia & Pacific (IDA & IBRD countries)EcuadorEgypt, Arab Rep.El SalvadorEquatorial GuineaEritreaEstoniaEthiopiaEuro areaEurope & Central AsiaEurope & Central Asia (excluding high income)Europe & Central Asia (IDA & IBRD countries)European UnionFaroe IslandsFijiFinlandFragile and conflict affected situationsFranceFrench PolynesiaGabonGambia, TheGeorgiaGermanyGhanaGreeceGrenadaGuatemalaGuineaGuinea-BissauGuyanaHaitiHeavily indebted poor countries (HIPC)High incomeHondurasHong Kong SAR, ChinaHungaryIBRD onlyIcelandIDA & IBRD totalIDA blendIDA onlyIDA totalIndiaIndonesiaIran, Islamic Rep.IraqIrelandIsraelItalyJamaicaJapanJordanKazakhstanKenyaKiribatiKorea, Rep.KosovoKuwaitKyrgyz RepublicLao PDRLate-demographic dividendLatin America & Caribbean Latin America & Caribbean (excluding high income)Latin America & the Caribbean (IDA & IBRD countries)LatviaLeast developed countries: UN classificationLebanonLesothoLiberiaLibyaLithuaniaLow & middle incomeLow incomeLower middle incomeLuxembourgMacao SAR, ChinaMacedonia, FYRMadagascarMalawiMalaysiaMaldivesMaliMaltaMarshall IslandsMauritaniaMauritiusMexicoMicronesia, Fed. Sts.Middle East & North Africa (excluding high income)Middle East & North Africa (IDA & IBRD countries)Middle incomeMoldovaMongoliaMontenegroMoroccoMozambiqueMyanmarNamibiaNepalNetherlandsNew CaledoniaNicaraguaNigerNigeriaNorth AmericaNorwayOECD membersOmanOther small statesPacific island small statesPakistanPalauPanamaPapua New GuineaParaguayPeruPhilippinesPolandPortugalPost-demographic dividendPre-demographic dividendQatarRomaniaRussian FederationRwandaSamoaSao Tome and PrincipeSaudi ArabiaSenegalSerbiaSeychellesSierra LeoneSingaporeSint Maarten (Dutch part)Slovak RepublicSloveniaSmall statesSolomon IslandsSouth AfricaSouth AsiaSouth Asia (IDA & IBRD)South SudanSpainSri LankaSt. Kitts and NevisSt. LuciaSt. Vincent and the GrenadinesSub-Saharan Africa Sub-Saharan Africa (excluding high income)Sub-Saharan Africa (IDA & IBRD countries)SudanSurinameSwazilandSwedenSwitzerlandSyrian Arab RepublicTajikistanTanzaniaThailandTimor-LesteTogoTongaTrinidad and TobagoTunisiaTurkeyTuvaluUgandaUkraineUnited KingdomUnited StatesUpper middle incomeUruguayVanuatuVenezuela, RBVietnamWest Bank and GazaWorldYemen, Rep.ZambiaZimbabwe Timeline:
This timeline shows a graph from 1976 to 2016 of France. No data until 1975. Number of actual observations by date: 41.
Source name:
World Development Indicators
Source organization:
International Monetary Fund, Balance of Payments Statistics Yearbook and data files.
Categories, topics:
Economy & Growth, Trade
Last updated:
apr 23, 2017
Indicators value changes by year
Minimum:
63.024 bln
jan 1, 1976
Maximum:
887.976 bln
jan 1, 2015
At the date of observation
Value
Absolute change
Change from previous value
jan 1, 1976
63.024 bln
+63.024 bln
0.0%
jan 1, 1977
74.123 bln
+11.099 bln
17.61%
jan 1, 1978
82.527 bln
+8.404 bln
11.34%
jan 1, 1979
95.885 bln
+13.358 bln
16.19%
jan 1, 1980
123.952 bln
+28.067 bln
29.27%
jan 1, 1981
154.336 bln
+30.384 bln
24.51%
jan 1, 1982
145.119 bln
-9.217 bln
-5.97%
jan 1, 1983
136.071 bln
-9.048 bln
-6.24%
jan 1, 1984
125.042 bln
-11.029 bln
-8.11%
jan 1, 1985
122.977 bln
-2.065 bln
-1.65%
jan 1, 1986
127.656 bln
+4.679 bln
3.8%
jan 1, 1987
154.895 bln
+27.239 bln
21.34%
jan 1, 1988
190.837 bln
+35.941 bln
23.2%
jan 1, 1989
212.642 bln
+21.805 bln
11.43%
jan 1, 1990
228.723 bln
+16.082 bln
7.56%
jan 1, 1991
283.183 bln
+54.46 bln
23.81%
jan 1, 1992
282.576 bln
-607.558 mln
-0.21%
jan 1, 1993
297.718 bln
+15.142 bln
5.36%
jan 1, 1994
261.064 bln
-36.654 bln
-12.31%
jan 1, 1995
281.236 bln
+20.172 bln
7.73%
jan 1, 1996
333.746 bln
+52.51 bln
18.67%
jan 1, 1997
334.186 bln
+440.246 mln
0.13%
jan 1, 1998
323.336 bln
-10.85 bln
-3.25%
jan 1, 1999
345.812 bln
+22.476 bln
6.95%
jan 1, 2000
365.293 bln
+19.48 bln
5.63%
jan 1, 2001
377.327 bln
+12.035 bln
3.29%
jan 1, 2002
373.821 bln
-3.506 bln
-0.93%
jan 1, 2003
390.706 bln
+16.885 bln
4.52%
jan 1, 2004
461.195 bln
+70.49 bln
18.04%
jan 1, 2005
541.825 bln
+80.63 bln
17.48%
jan 1, 2006
593.448 bln
+51.623 bln
9.53%
jan 1, 2007
658.429 bln
+64.981 bln
10.95%
jan 1, 2008
759.748 bln
+101.319 bln
15.39%
jan 1, 2009
869.247 bln
+109.499 bln
14.41%
jan 1, 2010
697.448 bln
-171.8 bln
-19.76%
jan 1, 2011
753.043 bln
+55.595 bln
7.97%
jan 1, 2012
879.805 bln
+126.763 bln
16.83%
jan 1, 2013
833.376 bln
-46.429 bln
-5.28%
jan 1, 2014
867.202 bln
+33.826 bln
4.06%
jan 1, 2015
887.976 bln
+20.774 bln
2.4%
jan 1, 2016
769.223 bln
-118.753 bln
-13.37%
Ranking of countries by current statistics by years


Comments: