29
/
en
AIzaSyAYiBZKx7MnpbEhh9jyipgxe19OcubqV5w
April 1, 2024
215395
Oman
OMN
true
2
1
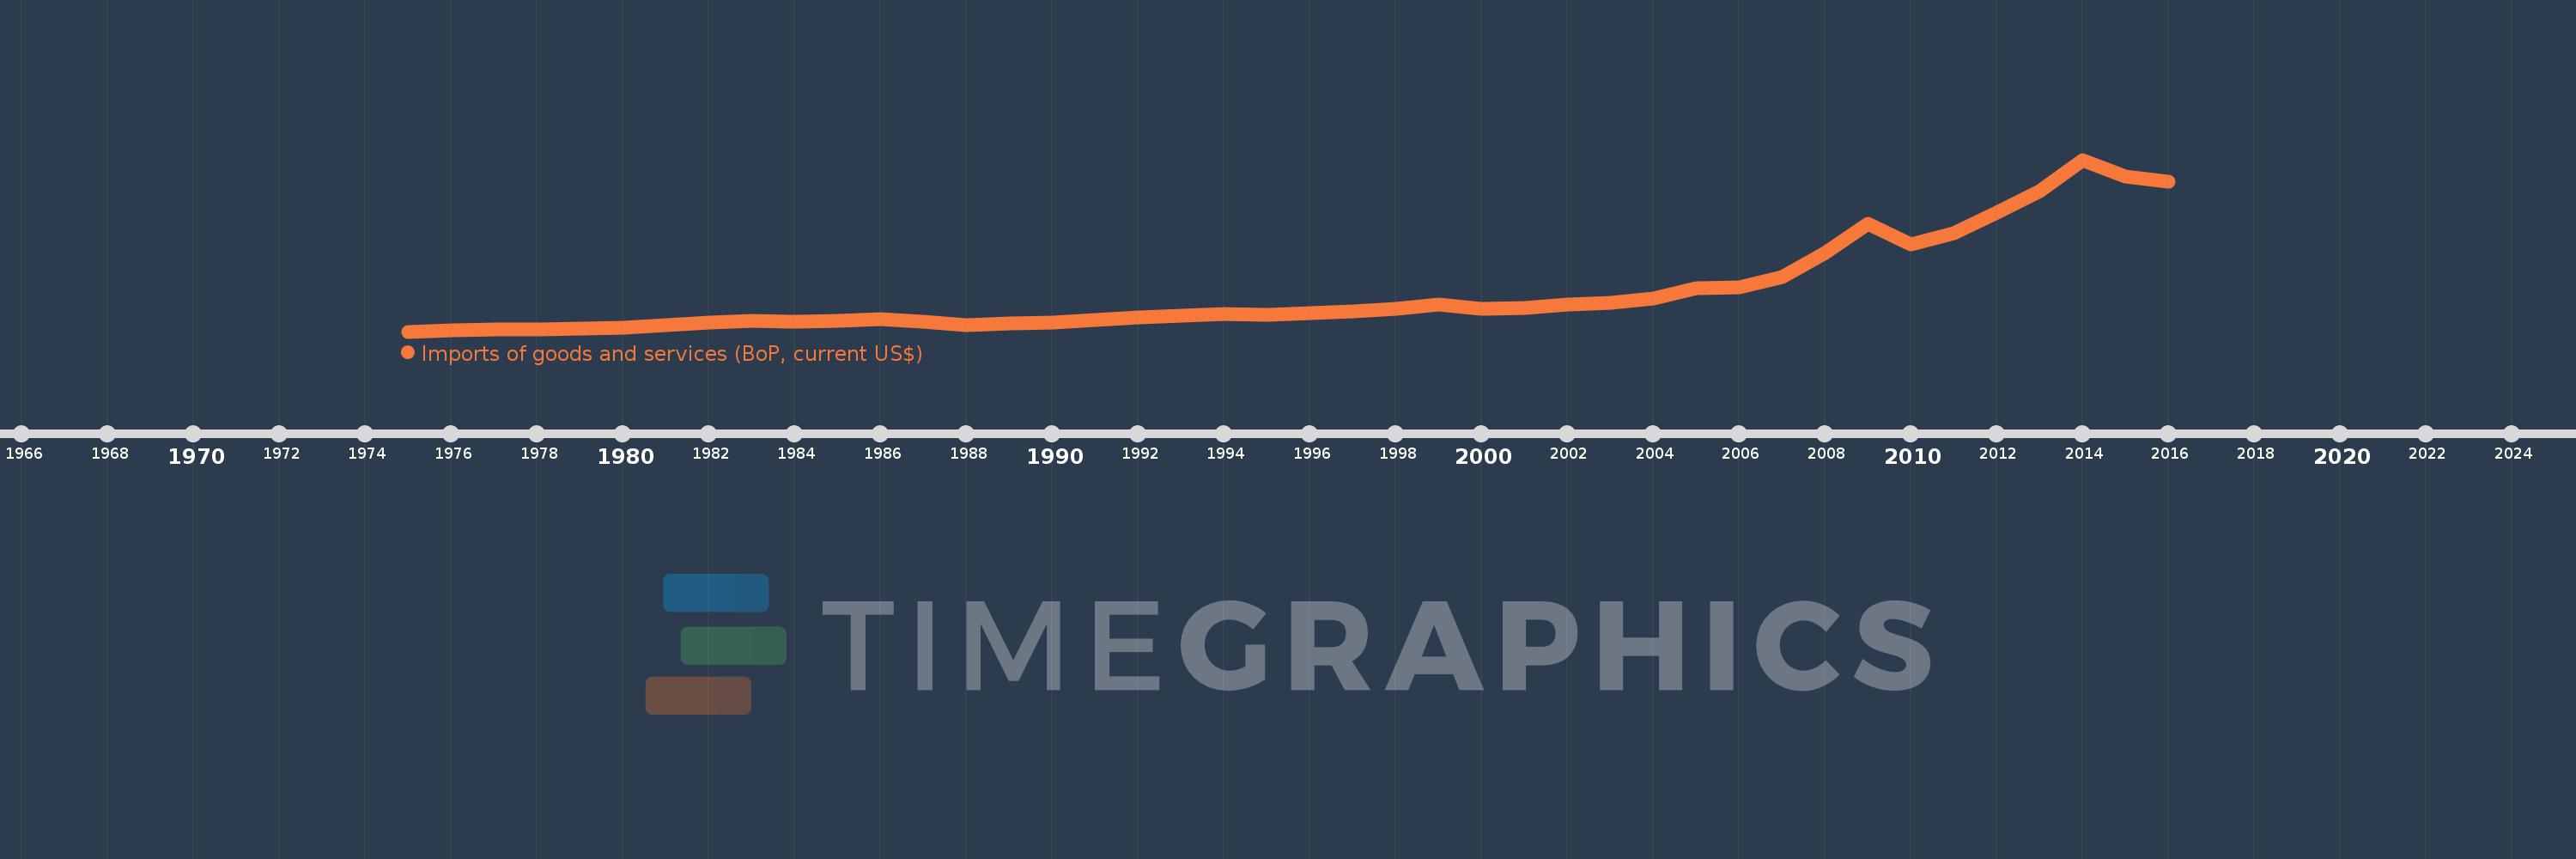
Imports of goods and services (BoP, current US$)
2016,2015,2014,2013,2012,2011,2010,2009,2008,2007,2006,2005,2004,2003,2002,2001,2000,1999,1998,1997,1996,1995,1994,1993,1992,1991,1990,1989,1988,1987,1986,1985,1984,1983,1982,1981,1980,1979,1978,1977,1976,1975
This statistics in other country:
AfghanistanAlbaniaAlgeriaAngolaAntigua and BarbudaArab WorldArgentinaArmeniaArubaAustraliaAustriaAzerbaijanBahamas, TheBahrainBangladeshBarbadosBelarusBelgiumBelizeBeninBermudaBhutanBoliviaBosnia and HerzegovinaBotswanaBrazilBrunei DarussalamBulgariaBurkina FasoBurundiCabo VerdeCambodiaCameroonCanadaCaribbean small statesCentral African RepublicCentral Europe and the BalticsChadChileChinaColombiaComorosCongo, Dem. Rep.Congo, Rep.Costa RicaCote d'IvoireCroatiaCuracaoCyprusCzech RepublicDenmarkDjiboutiDominicaDominican RepublicEarly-demographic dividendEast Asia & PacificEast Asia & Pacific (excluding high income)East Asia & Pacific (IDA & IBRD countries)EcuadorEgypt, Arab Rep.El SalvadorEquatorial GuineaEritreaEstoniaEthiopiaEuro areaEurope & Central AsiaEurope & Central Asia (excluding high income)Europe & Central Asia (IDA & IBRD countries)European UnionFaroe IslandsFijiFinlandFragile and conflict affected situationsFranceFrench PolynesiaGabonGambia, TheGeorgiaGermanyGhanaGreeceGrenadaGuatemalaGuineaGuinea-BissauGuyanaHaitiHeavily indebted poor countries (HIPC)High incomeHondurasHong Kong SAR, ChinaHungaryIBRD onlyIcelandIDA & IBRD totalIDA blendIDA onlyIDA totalIndiaIndonesiaIran, Islamic Rep.IraqIrelandIsraelItalyJamaicaJapanJordanKazakhstanKenyaKiribatiKorea, Rep.KosovoKuwaitKyrgyz RepublicLao PDRLate-demographic dividendLatin America & Caribbean Latin America & Caribbean (excluding high income)Latin America & the Caribbean (IDA & IBRD countries)LatviaLeast developed countries: UN classificationLebanonLesothoLiberiaLibyaLithuaniaLow & middle incomeLow incomeLower middle incomeLuxembourgMacao SAR, ChinaMacedonia, FYRMadagascarMalawiMalaysiaMaldivesMaliMaltaMarshall IslandsMauritaniaMauritiusMexicoMicronesia, Fed. Sts.Middle East & North Africa (excluding high income)Middle East & North Africa (IDA & IBRD countries)Middle incomeMoldovaMongoliaMontenegroMoroccoMozambiqueMyanmarNamibiaNepalNetherlandsNew CaledoniaNicaraguaNigerNigeriaNorth AmericaNorwayOECD membersOmanOther small statesPacific island small statesPakistanPalauPanamaPapua New GuineaParaguayPeruPhilippinesPolandPortugalPost-demographic dividendPre-demographic dividendQatarRomaniaRussian FederationRwandaSamoaSao Tome and PrincipeSaudi ArabiaSenegalSerbiaSeychellesSierra LeoneSingaporeSint Maarten (Dutch part)Slovak RepublicSloveniaSmall statesSolomon IslandsSouth AfricaSouth AsiaSouth Asia (IDA & IBRD)South SudanSpainSri LankaSt. Kitts and NevisSt. LuciaSt. Vincent and the GrenadinesSub-Saharan Africa Sub-Saharan Africa (excluding high income)Sub-Saharan Africa (IDA & IBRD countries)SudanSurinameSwazilandSwedenSwitzerlandSyrian Arab RepublicTajikistanTanzaniaThailandTimor-LesteTogoTongaTrinidad and TobagoTunisiaTurkeyTuvaluUgandaUkraineUnited KingdomUnited StatesUpper middle incomeUruguayVanuatuVenezuela, RBVietnamWest Bank and GazaWorldYemen, Rep.ZambiaZimbabwe Timeline:
This timeline shows a graph from 1975 to 2016 of Oman. No data until 1974. Number of actual observations by date: 42.
Source name:
World Development Indicators
Source organization:
International Monetary Fund, Balance of Payments Statistics Yearbook and data files.
Categories, topics:
Economy & Growth, Trade
Last updated:
apr 23, 2017
Indicators value changes by year
Minimum:
655.182 mln
jan 1, 1975
Maximum:
41.83 bln
jan 1, 2014
At the date of observation
Value
Absolute change
Change from previous value
jan 1, 1975
655.182 mln
+655.182 mln
0.0%
jan 1, 1976
1.063 bln
+407.643 mln
62.22%
jan 1, 1977
1.177 bln
+114.071 mln
10.73%
jan 1, 1978
1.23 bln
+52.982 mln
4.5%
jan 1, 1979
1.35 bln
+120.44 mln
9.79%
jan 1, 1980
1.52 bln
+169.658 mln
12.56%
jan 1, 1981
2.298 bln
+777.649 mln
51.16%
jan 1, 1982
2.917 bln
+618.992 mln
26.94%
jan 1, 1983
3.283 bln
+366.821 mln
12.58%
jan 1, 1984
3.048 bln
-235.09 mln
-7.16%
jan 1, 1985
3.312 bln
+263.776 mln
8.65%
jan 1, 1986
3.741 bln
+428.519 mln
12.94%
jan 1, 1987
2.998 bln
-743.121 mln
-19.87%
jan 1, 1988
2.25 bln
-747.849 mln
-24.95%
jan 1, 1989
2.629 bln
+379.714 mln
16.88%
jan 1, 1990
2.796 bln
+166.45 mln
6.33%
jan 1, 1991
3.342 bln
+546.164 mln
19.53%
jan 1, 1992
4.073 bln
+730.819 mln
21.87%
jan 1, 1993
4.559 bln
+486.346 mln
11.94%
jan 1, 1994
4.936 bln
+377.113 mln
8.27%
jan 1, 1995
4.593 bln
-343.043 mln
-6.95%
jan 1, 1996
5.035 bln
+441.873 mln
9.62%
jan 1, 1997
5.559 bln
+523.989 mln
10.41%
jan 1, 1998
6.201 bln
+641.5 mln
11.54%
jan 1, 1999
7.104 bln
+903.5 mln
14.57%
jan 1, 2000
6.013 bln
-1.092 bln
-15.37%
jan 1, 2001
6.351 bln
+338.999 mln
5.64%
jan 1, 2002
7.207 bln
+855.783 mln
13.47%
jan 1, 2003
7.513 bln
+306.112 mln
4.25%
jan 1, 2004
8.659 bln
+1.146 bln
15.25%
jan 1, 2005
11.025 bln
+2.366 bln
27.32%
jan 1, 2006
11.174 bln
+149.233 mln
1.35%
jan 1, 2007
13.777 bln
+2.603 bln
23.3%
jan 1, 2008
19.438 bln
+5.661 bln
41.09%
jan 1, 2009
26.585 bln
+7.147 bln
36.77%
jan 1, 2010
21.535 bln
-5.05 bln
-18.99%
jan 1, 2011
24.239 bln
+2.704 bln
12.56%
jan 1, 2012
29.237 bln
+4.997 bln
20.62%
jan 1, 2013
34.398 bln
+5.161 bln
17.65%
jan 1, 2014
41.83 bln
+7.432 bln
21.61%
jan 1, 2015
37.859 bln
-3.971 bln
-9.49%
jan 1, 2016
36.666 bln
-1.193 bln
-3.15%
Ranking of countries by current statistics by years


Comments: