29
/
en
AIzaSyAYiBZKx7MnpbEhh9jyipgxe19OcubqV5w
April 1, 2024
145792
Guinea
GIN
true
2
1
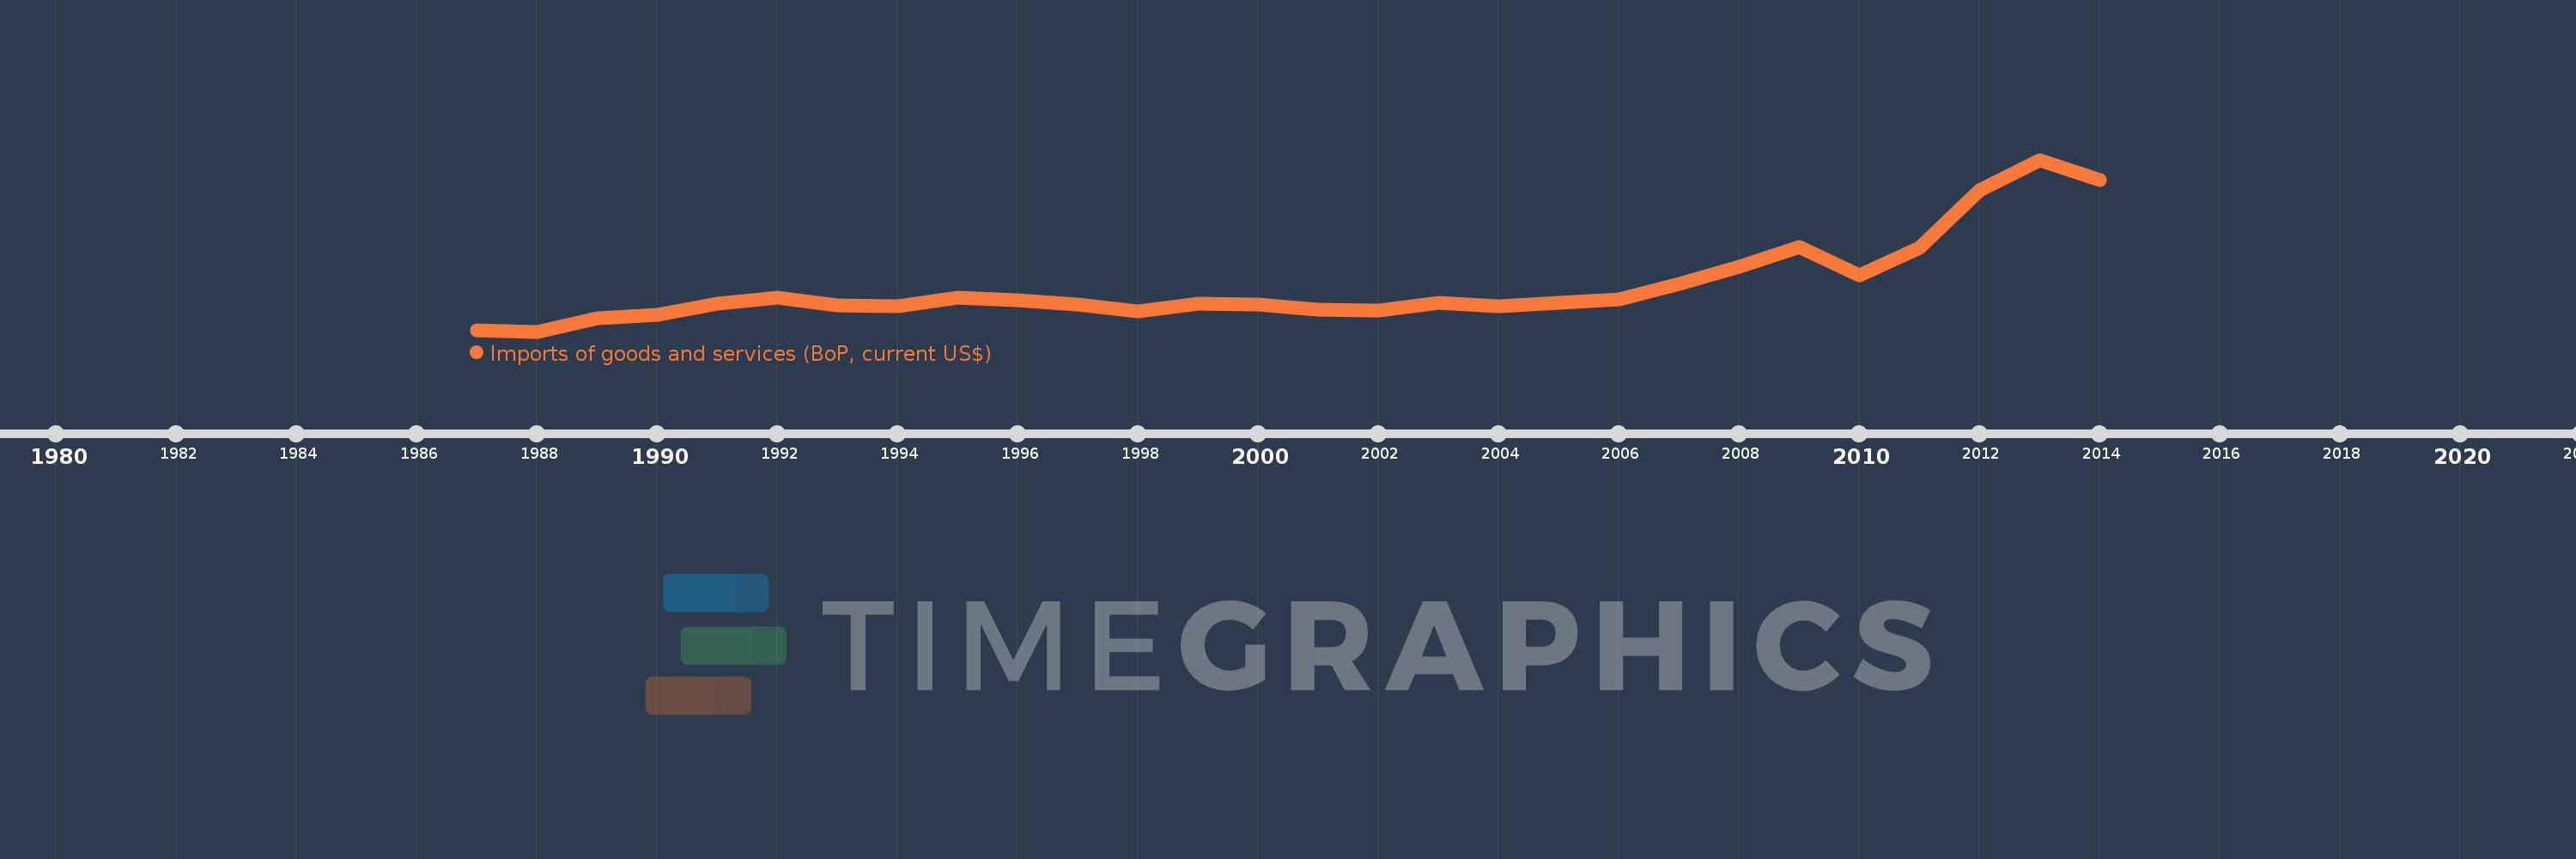
Imports of goods and services (BoP, current US$)
2014,2013,2012,2011,2010,2009,2008,2007,2006,2005,2004,2003,2002,2001,2000,1999,1998,1997,1996,1995,1994,1993,1992,1991,1990,1989,1988,1987
This statistics in other country:
AfghanistanAlbaniaAlgeriaAngolaAntigua and BarbudaArab WorldArgentinaArmeniaArubaAustraliaAustriaAzerbaijanBahamas, TheBahrainBangladeshBarbadosBelarusBelgiumBelizeBeninBermudaBhutanBoliviaBosnia and HerzegovinaBotswanaBrazilBrunei DarussalamBulgariaBurkina FasoBurundiCabo VerdeCambodiaCameroonCanadaCaribbean small statesCentral African RepublicCentral Europe and the BalticsChadChileChinaColombiaComorosCongo, Dem. Rep.Congo, Rep.Costa RicaCote d'IvoireCroatiaCuracaoCyprusCzech RepublicDenmarkDjiboutiDominicaDominican RepublicEarly-demographic dividendEast Asia & PacificEast Asia & Pacific (excluding high income)East Asia & Pacific (IDA & IBRD countries)EcuadorEgypt, Arab Rep.El SalvadorEquatorial GuineaEritreaEstoniaEthiopiaEuro areaEurope & Central AsiaEurope & Central Asia (excluding high income)Europe & Central Asia (IDA & IBRD countries)European UnionFaroe IslandsFijiFinlandFragile and conflict affected situationsFranceFrench PolynesiaGabonGambia, TheGeorgiaGermanyGhanaGreeceGrenadaGuatemalaGuineaGuinea-BissauGuyanaHaitiHeavily indebted poor countries (HIPC)High incomeHondurasHong Kong SAR, ChinaHungaryIBRD onlyIcelandIDA & IBRD totalIDA blendIDA onlyIDA totalIndiaIndonesiaIran, Islamic Rep.IraqIrelandIsraelItalyJamaicaJapanJordanKazakhstanKenyaKiribatiKorea, Rep.KosovoKuwaitKyrgyz RepublicLao PDRLate-demographic dividendLatin America & Caribbean Latin America & Caribbean (excluding high income)Latin America & the Caribbean (IDA & IBRD countries)LatviaLeast developed countries: UN classificationLebanonLesothoLiberiaLibyaLithuaniaLow & middle incomeLow incomeLower middle incomeLuxembourgMacao SAR, ChinaMacedonia, FYRMadagascarMalawiMalaysiaMaldivesMaliMaltaMarshall IslandsMauritaniaMauritiusMexicoMicronesia, Fed. Sts.Middle East & North Africa (excluding high income)Middle East & North Africa (IDA & IBRD countries)Middle incomeMoldovaMongoliaMontenegroMoroccoMozambiqueMyanmarNamibiaNepalNetherlandsNew CaledoniaNicaraguaNigerNigeriaNorth AmericaNorwayOECD membersOmanOther small statesPacific island small statesPakistanPalauPanamaPapua New GuineaParaguayPeruPhilippinesPolandPortugalPost-demographic dividendPre-demographic dividendQatarRomaniaRussian FederationRwandaSamoaSao Tome and PrincipeSaudi ArabiaSenegalSerbiaSeychellesSierra LeoneSingaporeSint Maarten (Dutch part)Slovak RepublicSloveniaSmall statesSolomon IslandsSouth AfricaSouth AsiaSouth Asia (IDA & IBRD)South SudanSpainSri LankaSt. Kitts and NevisSt. LuciaSt. Vincent and the GrenadinesSub-Saharan Africa Sub-Saharan Africa (excluding high income)Sub-Saharan Africa (IDA & IBRD countries)SudanSurinameSwazilandSwedenSwitzerlandSyrian Arab RepublicTajikistanTanzaniaThailandTimor-LesteTogoTongaTrinidad and TobagoTunisiaTurkeyTuvaluUgandaUkraineUnited KingdomUnited StatesUpper middle incomeUruguayVanuatuVenezuela, RBVietnamWest Bank and GazaWorldYemen, Rep.ZambiaZimbabwe Timeline:
This timeline shows a graph from 1987 to 2014 of Guinea. No data until 1986. Number of actual observations by date: 28.
Source name:
World Development Indicators
Source organization:
International Monetary Fund, Balance of Payments Statistics Yearbook and data files.
Categories, topics:
Economy & Growth, Trade
Last updated:
apr 23, 2017
Indicators value changes by year
Minimum:
534.27 mln
jan 1, 1988
Maximum:
3.136 bln
jan 1, 2013
At the date of observation
Value
Absolute change
Change from previous value
jan 1, 1987
560.06 mln
+560.06 mln
0.0%
jan 1, 1988
534.27 mln
-25.79 mln
-4.6%
jan 1, 1989
741.42 mln
+207.15 mln
38.77%
jan 1, 1990
791.32 mln
+49.9 mln
6.73%
jan 1, 1991
953.0 mln
+161.68 mln
20.43%
jan 1, 1992
1.043 bln
+89.69 mln
9.41%
jan 1, 1993
930.92 mln
-111.77 mln
-10.72%
jan 1, 1994
917.41 mln
-13.51 mln
-1.45%
jan 1, 1995
1.051 bln
+133.96 mln
14.6%
jan 1, 1996
1.011 bln
-40.307 mln
-3.83%
jan 1, 1997
947.51 mln
-63.553 mln
-6.29%
jan 1, 1998
834.08 mln
-113.43 mln
-11.97%
jan 1, 1999
954.706 mln
+120.626 mln
14.46%
jan 1, 2000
946.09 mln
-8.616 mln
-0.9%
jan 1, 2001
871.755 mln
-74.335 mln
-7.86%
jan 1, 2002
856.143 mln
-15.612 mln
-1.79%
jan 1, 2003
974.679 mln
+118.536 mln
13.85%
jan 1, 2004
924.435 mln
-50.244 mln
-5.15%
jan 1, 2005
963.63 mln
+39.195 mln
4.24%
jan 1, 2006
1.028 bln
+63.93 mln
6.63%
jan 1, 2007
1.256 bln
+228.45 mln
22.23%
jan 1, 2008
1.513 bln
+256.74 mln
20.44%
jan 1, 2009
1.81 bln
+297.65 mln
19.68%
jan 1, 2010
1.391 bln
-419.6 mln
-23.18%
jan 1, 2011
1.8 bln
+409.65 mln
29.45%
jan 1, 2012
2.673 bln
+872.73 mln
48.47%
jan 1, 2013
3.136 bln
+462.56 mln
17.3%
jan 1, 2014
2.833 bln
-302.32 mln
-9.64%
Ranking of countries by current statistics by years


Comments: