29
/
en
AIzaSyAYiBZKx7MnpbEhh9jyipgxe19OcubqV5w
April 1, 2024
223689
Philippines
PHL
true
2
1
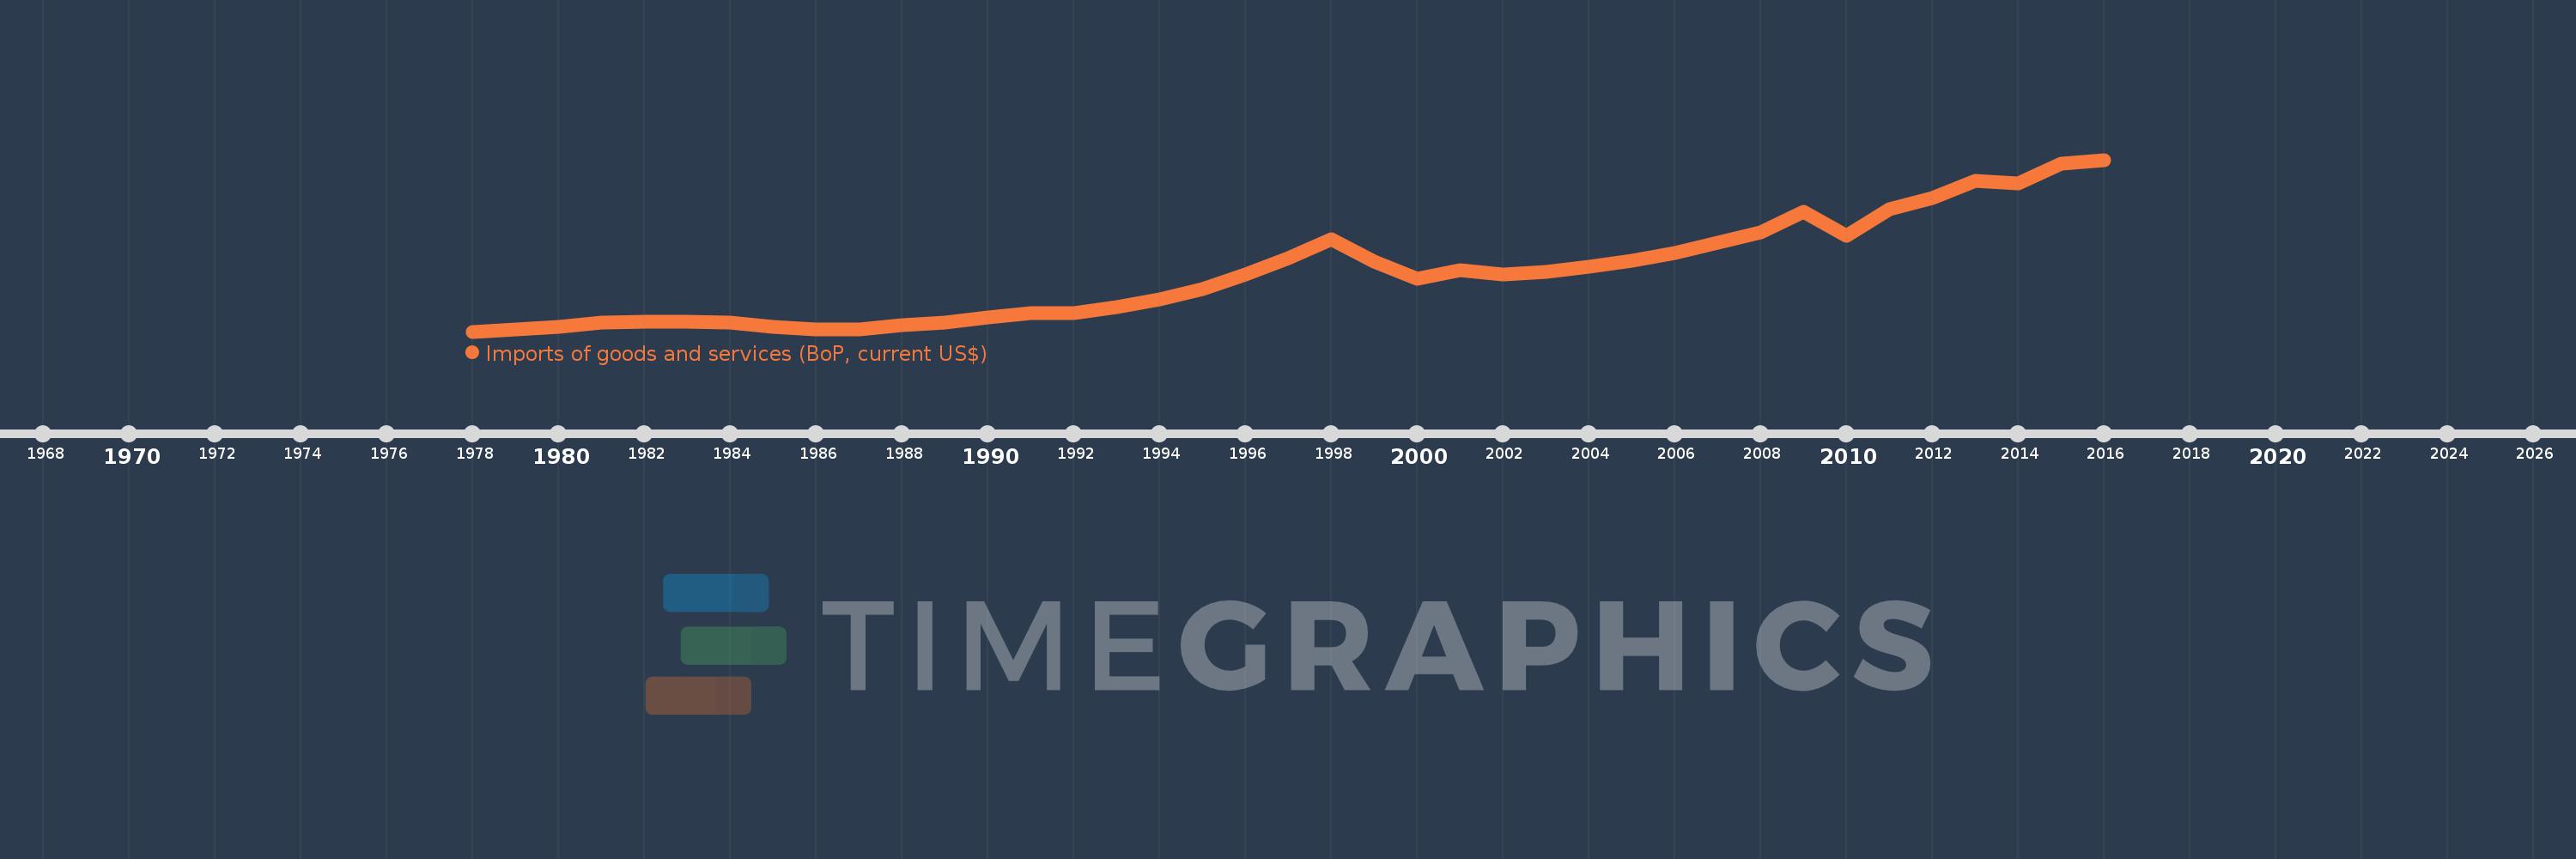
Imports of goods and services (BoP, current US$)
2016,2015,2014,2013,2012,2011,2010,2009,2008,2007,2006,2005,2004,2003,2002,2001,2000,1999,1998,1997,1996,1995,1994,1993,1992,1991,1990,1989,1988,1987,1986,1985,1984,1983,1982,1981,1980,1979,1978
This statistics in other country:
AfghanistanAlbaniaAlgeriaAngolaAntigua and BarbudaArab WorldArgentinaArmeniaArubaAustraliaAustriaAzerbaijanBahamas, TheBahrainBangladeshBarbadosBelarusBelgiumBelizeBeninBermudaBhutanBoliviaBosnia and HerzegovinaBotswanaBrazilBrunei DarussalamBulgariaBurkina FasoBurundiCabo VerdeCambodiaCameroonCanadaCaribbean small statesCentral African RepublicCentral Europe and the BalticsChadChileChinaColombiaComorosCongo, Dem. Rep.Congo, Rep.Costa RicaCote d'IvoireCroatiaCuracaoCyprusCzech RepublicDenmarkDjiboutiDominicaDominican RepublicEarly-demographic dividendEast Asia & PacificEast Asia & Pacific (excluding high income)East Asia & Pacific (IDA & IBRD countries)EcuadorEgypt, Arab Rep.El SalvadorEquatorial GuineaEritreaEstoniaEthiopiaEuro areaEurope & Central AsiaEurope & Central Asia (excluding high income)Europe & Central Asia (IDA & IBRD countries)European UnionFaroe IslandsFijiFinlandFragile and conflict affected situationsFranceFrench PolynesiaGabonGambia, TheGeorgiaGermanyGhanaGreeceGrenadaGuatemalaGuineaGuinea-BissauGuyanaHaitiHeavily indebted poor countries (HIPC)High incomeHondurasHong Kong SAR, ChinaHungaryIBRD onlyIcelandIDA & IBRD totalIDA blendIDA onlyIDA totalIndiaIndonesiaIran, Islamic Rep.IraqIrelandIsraelItalyJamaicaJapanJordanKazakhstanKenyaKiribatiKorea, Rep.KosovoKuwaitKyrgyz RepublicLao PDRLate-demographic dividendLatin America & Caribbean Latin America & Caribbean (excluding high income)Latin America & the Caribbean (IDA & IBRD countries)LatviaLeast developed countries: UN classificationLebanonLesothoLiberiaLibyaLithuaniaLow & middle incomeLow incomeLower middle incomeLuxembourgMacao SAR, ChinaMacedonia, FYRMadagascarMalawiMalaysiaMaldivesMaliMaltaMarshall IslandsMauritaniaMauritiusMexicoMicronesia, Fed. Sts.Middle East & North Africa (excluding high income)Middle East & North Africa (IDA & IBRD countries)Middle incomeMoldovaMongoliaMontenegroMoroccoMozambiqueMyanmarNamibiaNepalNetherlandsNew CaledoniaNicaraguaNigerNigeriaNorth AmericaNorwayOECD membersOmanOther small statesPacific island small statesPakistanPalauPanamaPapua New GuineaParaguayPeruPhilippinesPolandPortugalPost-demographic dividendPre-demographic dividendQatarRomaniaRussian FederationRwandaSamoaSao Tome and PrincipeSaudi ArabiaSenegalSerbiaSeychellesSierra LeoneSingaporeSint Maarten (Dutch part)Slovak RepublicSloveniaSmall statesSolomon IslandsSouth AfricaSouth AsiaSouth Asia (IDA & IBRD)South SudanSpainSri LankaSt. Kitts and NevisSt. LuciaSt. Vincent and the GrenadinesSub-Saharan Africa Sub-Saharan Africa (excluding high income)Sub-Saharan Africa (IDA & IBRD countries)SudanSurinameSwazilandSwedenSwitzerlandSyrian Arab RepublicTajikistanTanzaniaThailandTimor-LesteTogoTongaTrinidad and TobagoTunisiaTurkeyTuvaluUgandaUkraineUnited KingdomUnited StatesUpper middle incomeUruguayVanuatuVenezuela, RBVietnamWest Bank and GazaWorldYemen, Rep.ZambiaZimbabwe Timeline:
This timeline shows a graph from 1978 to 2016 of Philippines. No data until 1977. Number of actual observations by date: 39.
Source name:
World Development Indicators
Source organization:
International Monetary Fund, Balance of Payments Statistics Yearbook and data files.
Categories, topics:
Economy & Growth, Trade
Last updated:
apr 23, 2017
Indicators value changes by year
Minimum:
4.771 bln
jan 1, 1978
Maximum:
90.188 bln
jan 1, 2016
At the date of observation
Value
Absolute change
Change from previous value
jan 1, 1978
4.771 bln
+4.771 bln
0.0%
jan 1, 1979
5.732 bln
+961.0 mln
20.14%
jan 1, 1980
7.322 bln
+1.59 bln
27.74%
jan 1, 1981
9.166 bln
+1.844 bln
25.18%
jan 1, 1982
9.578 bln
+412.0 mln
4.49%
jan 1, 1983
9.49 bln
-88.0 mln
-0.92%
jan 1, 1984
9.22 bln
-270.0 mln
-2.85%
jan 1, 1985
7.264 bln
-1.956 bln
-21.21%
jan 1, 1986
5.978 bln
-1.286 bln
-17.7%
jan 1, 1987
5.888 bln
-90.0 mln
-1.51%
jan 1, 1988
7.892 bln
+2.004 bln
34.04%
jan 1, 1989
9.467 bln
+1.575 bln
19.96%
jan 1, 1990
11.983 bln
+2.516 bln
26.58%
jan 1, 1991
13.967 bln
+1.984 bln
16.56%
jan 1, 1992
13.855 bln
-112.0 mln
-0.8%
jan 1, 1993
16.827 bln
+2.972 bln
21.45%
jan 1, 1994
20.687 bln
+3.86 bln
22.94%
jan 1, 1995
25.987 bln
+5.3 bln
25.62%
jan 1, 1996
33.317 bln
+7.33 bln
28.21%
jan 1, 1997
41.314 bln
+7.997 bln
24.0%
jan 1, 1998
50.477 bln
+9.163 bln
22.18%
jan 1, 1999
39.631 bln
-10.846 bln
-21.49%
jan 1, 2000
31.176 bln
-8.455 bln
-21.33%
jan 1, 2001
35.302 bln
+4.126 bln
13.23%
jan 1, 2002
32.974 bln
-2.328 bln
-6.59%
jan 1, 2003
34.576 bln
+1.602 bln
4.86%
jan 1, 2004
37.022 bln
+2.446 bln
7.07%
jan 1, 2005
40.023 bln
+3.001 bln
8.11%
jan 1, 2006
43.771 bln
+3.748 bln
9.36%
jan 1, 2007
48.781 bln
+5.01 bln
11.45%
jan 1, 2008
54.312 bln
+5.531 bln
11.34%
jan 1, 2009
64.409 bln
+10.096 bln
18.59%
jan 1, 2010
52.189 bln
-12.219 bln
-18.97%
jan 1, 2011
65.648 bln
+13.459 bln
25.79%
jan 1, 2012
71.021 bln
+5.373 bln
8.18%
jan 1, 2013
79.571 bln
+8.55 bln
12.04%
jan 1, 2014
78.495 bln
-1.076 bln
-1.35%
jan 1, 2015
88.076 bln
+9.581 bln
12.21%
jan 1, 2016
90.188 bln
+2.112 bln
2.4%
Ranking of countries by current statistics by years


Comments: