29
/
en
AIzaSyAYiBZKx7MnpbEhh9jyipgxe19OcubqV5w
April 1, 2024
35825
High income
HIC
false
2
1
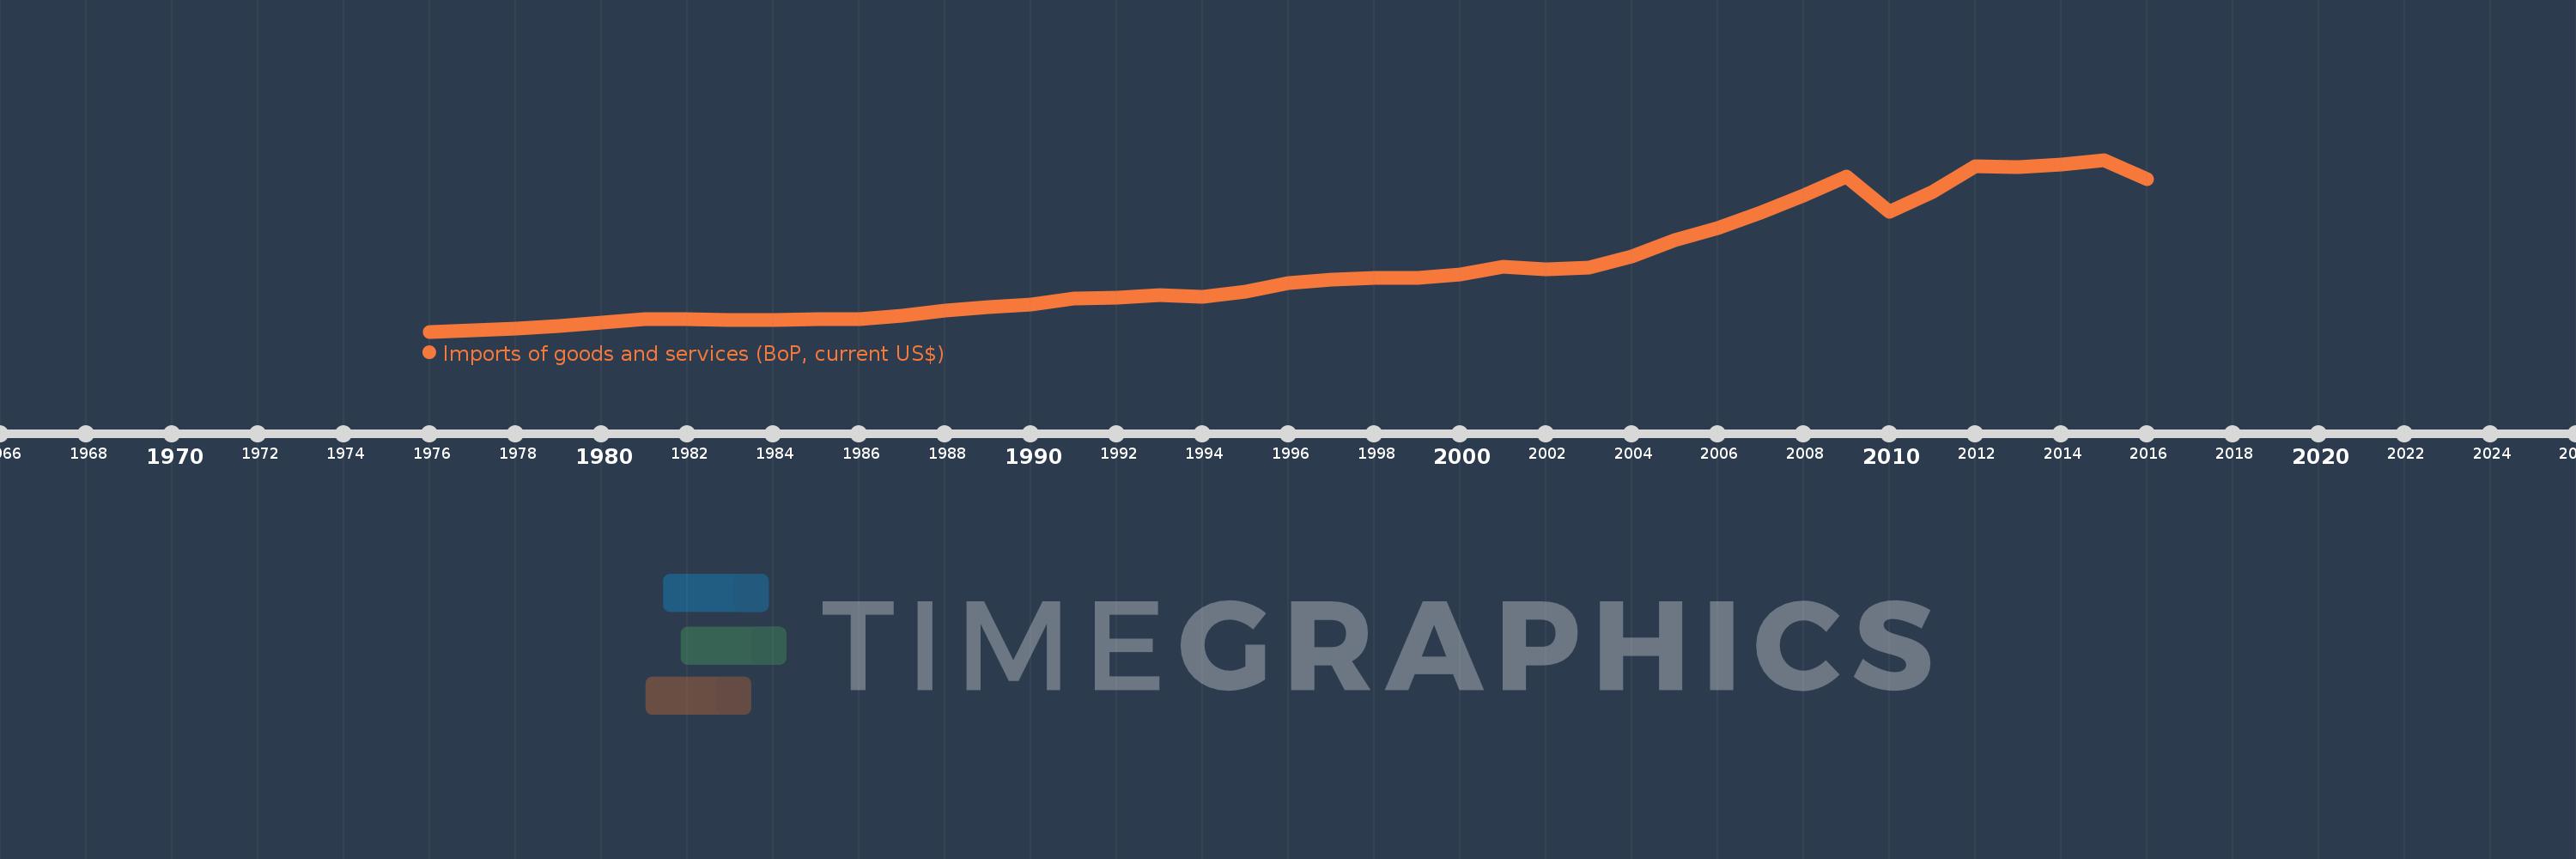
Imports of goods and services (BoP, current US$)
2016,2015,2014,2013,2012,2011,2010,2009,2008,2007,2006,2005,2004,2003,2002,2001,2000,1999,1998,1997,1996,1995,1994,1993,1992,1991,1990,1989,1988,1987,1986,1985,1984,1983,1982,1981,1980,1979,1978,1977,1976
This statistics in other country:
AfghanistanAlbaniaAlgeriaAngolaAntigua and BarbudaArab WorldArgentinaArmeniaArubaAustraliaAustriaAzerbaijanBahamas, TheBahrainBangladeshBarbadosBelarusBelgiumBelizeBeninBermudaBhutanBoliviaBosnia and HerzegovinaBotswanaBrazilBrunei DarussalamBulgariaBurkina FasoBurundiCabo VerdeCambodiaCameroonCanadaCaribbean small statesCentral African RepublicCentral Europe and the BalticsChadChileChinaColombiaComorosCongo, Dem. Rep.Congo, Rep.Costa RicaCote d'IvoireCroatiaCuracaoCyprusCzech RepublicDenmarkDjiboutiDominicaDominican RepublicEarly-demographic dividendEast Asia & PacificEast Asia & Pacific (excluding high income)East Asia & Pacific (IDA & IBRD countries)EcuadorEgypt, Arab Rep.El SalvadorEquatorial GuineaEritreaEstoniaEthiopiaEuro areaEurope & Central AsiaEurope & Central Asia (excluding high income)Europe & Central Asia (IDA & IBRD countries)European UnionFaroe IslandsFijiFinlandFragile and conflict affected situationsFranceFrench PolynesiaGabonGambia, TheGeorgiaGermanyGhanaGreeceGrenadaGuatemalaGuineaGuinea-BissauGuyanaHaitiHeavily indebted poor countries (HIPC)High incomeHondurasHong Kong SAR, ChinaHungaryIBRD onlyIcelandIDA & IBRD totalIDA blendIDA onlyIDA totalIndiaIndonesiaIran, Islamic Rep.IraqIrelandIsraelItalyJamaicaJapanJordanKazakhstanKenyaKiribatiKorea, Rep.KosovoKuwaitKyrgyz RepublicLao PDRLate-demographic dividendLatin America & Caribbean Latin America & Caribbean (excluding high income)Latin America & the Caribbean (IDA & IBRD countries)LatviaLeast developed countries: UN classificationLebanonLesothoLiberiaLibyaLithuaniaLow & middle incomeLow incomeLower middle incomeLuxembourgMacao SAR, ChinaMacedonia, FYRMadagascarMalawiMalaysiaMaldivesMaliMaltaMarshall IslandsMauritaniaMauritiusMexicoMicronesia, Fed. Sts.Middle East & North Africa (excluding high income)Middle East & North Africa (IDA & IBRD countries)Middle incomeMoldovaMongoliaMontenegroMoroccoMozambiqueMyanmarNamibiaNepalNetherlandsNew CaledoniaNicaraguaNigerNigeriaNorth AmericaNorwayOECD membersOmanOther small statesPacific island small statesPakistanPalauPanamaPapua New GuineaParaguayPeruPhilippinesPolandPortugalPost-demographic dividendPre-demographic dividendQatarRomaniaRussian FederationRwandaSamoaSao Tome and PrincipeSaudi ArabiaSenegalSerbiaSeychellesSierra LeoneSingaporeSint Maarten (Dutch part)Slovak RepublicSloveniaSmall statesSolomon IslandsSouth AfricaSouth AsiaSouth Asia (IDA & IBRD)South SudanSpainSri LankaSt. Kitts and NevisSt. LuciaSt. Vincent and the GrenadinesSub-Saharan Africa Sub-Saharan Africa (excluding high income)Sub-Saharan Africa (IDA & IBRD countries)SudanSurinameSwazilandSwedenSwitzerlandSyrian Arab RepublicTajikistanTanzaniaThailandTimor-LesteTogoTongaTrinidad and TobagoTunisiaTurkeyTuvaluUgandaUkraineUnited KingdomUnited StatesUpper middle incomeUruguayVanuatuVenezuela, RBVietnamWest Bank and GazaWorldYemen, Rep.ZambiaZimbabwe Timeline:
This timeline shows a graph from 1976 to 2016 of High income. No data until 1975. Number of actual observations by date: 41.
Source name:
World Development Indicators
Source organization:
International Monetary Fund, Balance of Payments Statistics Yearbook and data files.
Categories, topics:
Economy & Growth, Trade
Last updated:
apr 23, 2017
Indicators value changes by year
Minimum:
826.692 bln
jan 1, 1976
Maximum:
15.871 trl
jan 1, 2015
At the date of observation
Value
Absolute change
Change from previous value
jan 1, 1976
826.692 bln
+826.692 bln
0.0%
jan 1, 1977
956.516 bln
+129.824 bln
15.7%
jan 1, 1978
1.094 trl
+137.022 bln
14.33%
jan 1, 1979
1.28 trl
+186.612 bln
17.06%
jan 1, 1980
1.632 trl
+351.38 bln
27.45%
jan 1, 1981
1.942 trl
+310.468 bln
19.03%
jan 1, 1982
1.909 trl
-33.098 bln
-1.7%
jan 1, 1983
1.816 trl
-93.042 bln
-4.87%
jan 1, 1984
1.808 trl
-8.037 bln
-0.44%
jan 1, 1985
1.919 trl
+111.611 bln
6.17%
jan 1, 1986
1.953 trl
+33.678 bln
1.75%
jan 1, 1987
2.227 trl
+273.881 bln
14.02%
jan 1, 1988
2.634 trl
+407.309 bln
18.29%
jan 1, 1989
2.978 trl
+343.456 bln
13.04%
jan 1, 1990
3.208 trl
+230.268 bln
7.73%
jan 1, 1991
3.705 trl
+497.422 bln
15.51%
jan 1, 1992
3.807 trl
+101.35 bln
2.74%
jan 1, 1993
4.058 trl
+251.66 bln
6.61%
jan 1, 1994
3.881 trl
-177.062 bln
-4.36%
jan 1, 1995
4.308 trl
+427.01 bln
11.0%
jan 1, 1996
5.112 trl
+804.016 bln
18.66%
jan 1, 1997
5.35 trl
+237.861 bln
4.65%
jan 1, 1998
5.492 trl
+141.309 bln
2.64%
jan 1, 1999
5.514 trl
+22.74 bln
0.41%
jan 1, 2000
5.848 trl
+333.184 bln
6.04%
jan 1, 2001
6.514 trl
+666.11 bln
11.39%
jan 1, 2002
6.247 trl
-266.611 bln
-4.09%
jan 1, 2003
6.445 trl
+197.715 bln
3.16%
jan 1, 2004
7.394 trl
+949.664 bln
14.74%
jan 1, 2005
8.871 trl
+1.477 trl
19.97%
jan 1, 2006
9.91 trl
+1.039 trl
11.72%
jan 1, 2007
11.225 trl
+1.315 trl
13.27%
jan 1, 2008
12.762 trl
+1.537 trl
13.69%
jan 1, 2009
14.39 trl
+1.628 trl
12.76%
jan 1, 2010
11.282 trl
-3.107 trl
-21.59%
jan 1, 2011
13.077 trl
+1.795 trl
15.91%
jan 1, 2012
15.278 trl
+2.201 trl
16.83%
jan 1, 2013
15.206 trl
-71.942 bln
-0.47%
jan 1, 2014
15.476 trl
+269.948 bln
1.78%
jan 1, 2015
15.871 trl
+394.827 bln
2.55%
jan 1, 2016
14.172 trl
-1.699 trl
-10.7%
Ranking of countries by current statistics by years


Comments: