29
/
en
AIzaSyAYiBZKx7MnpbEhh9jyipgxe19OcubqV5w
April 1, 2024
87357
Bolivia
BOL
true
2
1
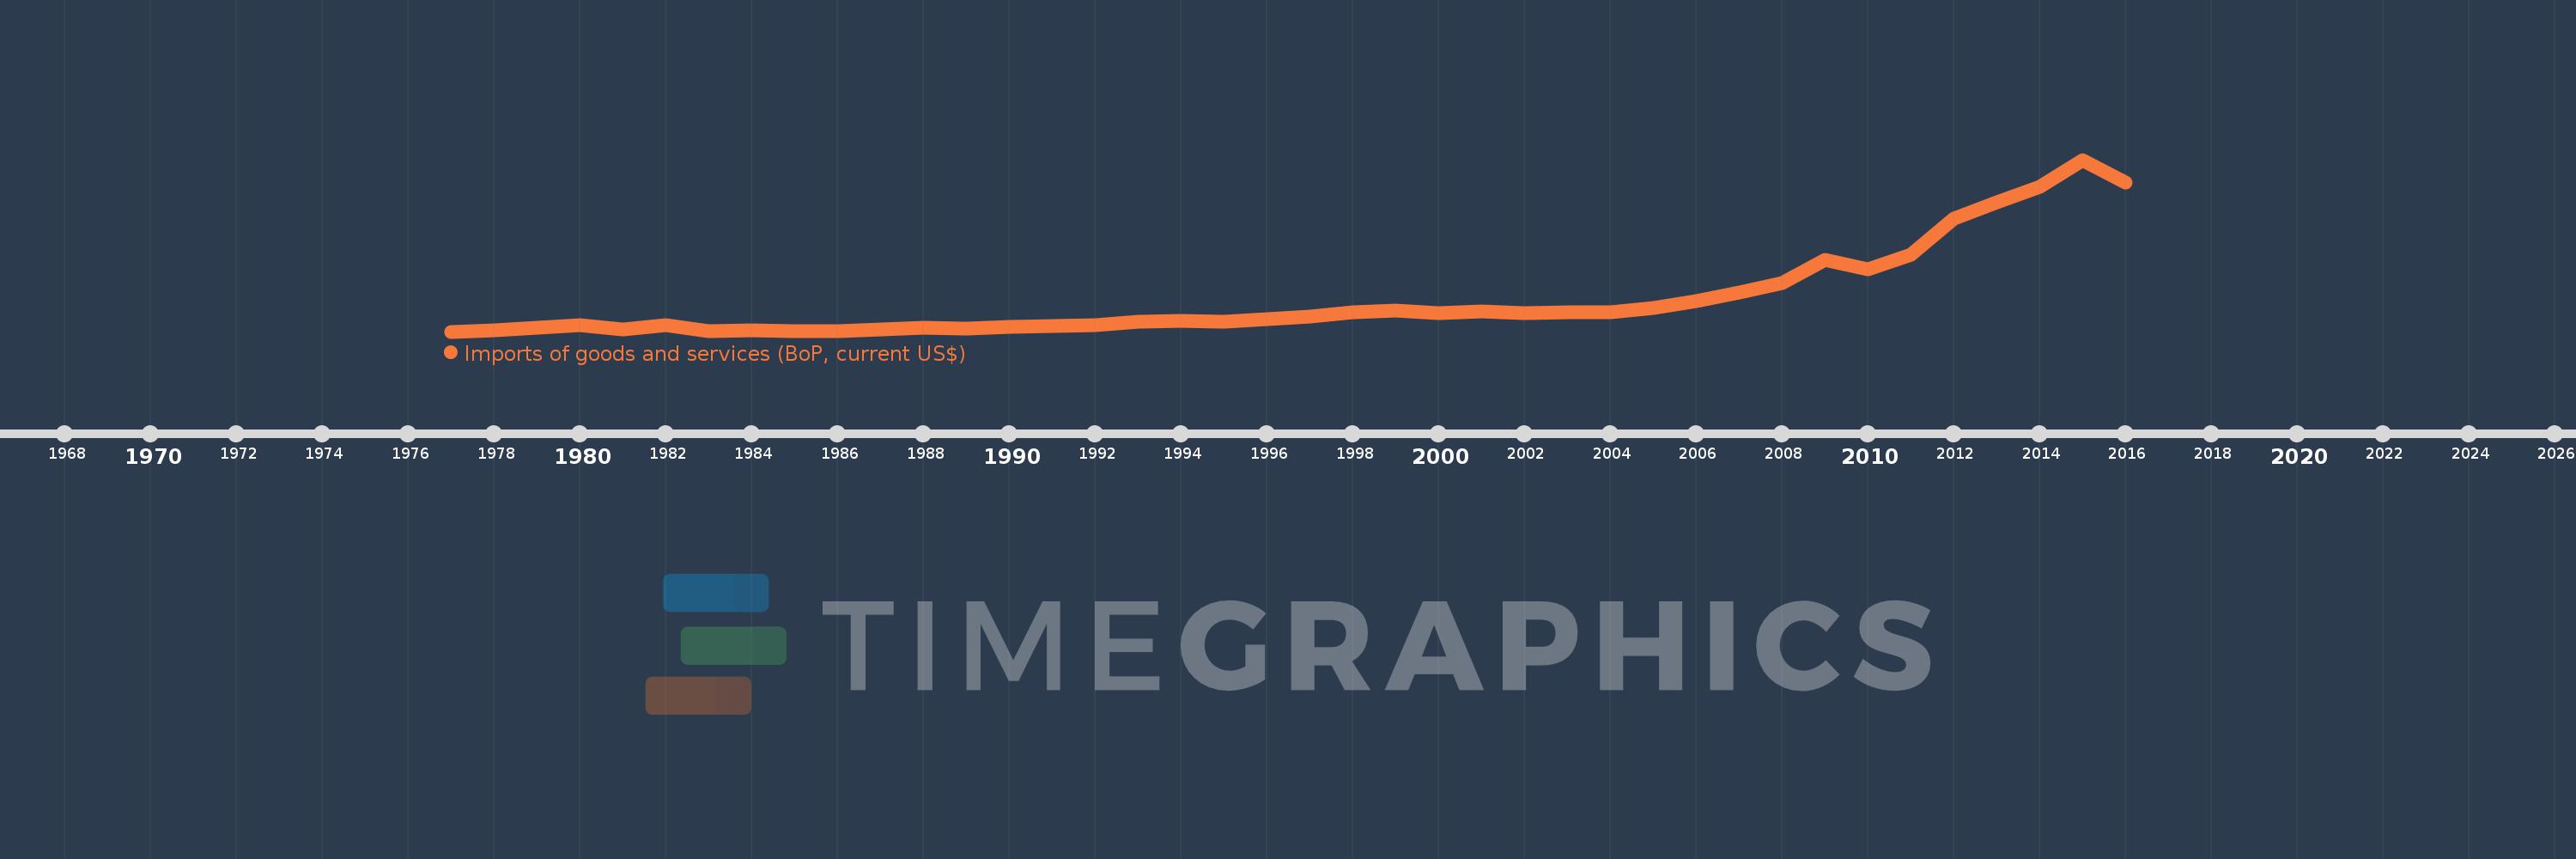
Imports of goods and services (BoP, current US$)
2016,2015,2014,2013,2012,2011,2010,2009,2008,2007,2006,2005,2004,2003,2002,2001,2000,1999,1998,1997,1996,1995,1994,1993,1992,1991,1990,1989,1988,1987,1986,1985,1984,1983,1982,1981,1980,1979,1978,1977
This statistics in other country:
AfghanistanAlbaniaAlgeriaAngolaAntigua and BarbudaArab WorldArgentinaArmeniaArubaAustraliaAustriaAzerbaijanBahamas, TheBahrainBangladeshBarbadosBelarusBelgiumBelizeBeninBermudaBhutanBoliviaBosnia and HerzegovinaBotswanaBrazilBrunei DarussalamBulgariaBurkina FasoBurundiCabo VerdeCambodiaCameroonCanadaCaribbean small statesCentral African RepublicCentral Europe and the BalticsChadChileChinaColombiaComorosCongo, Dem. Rep.Congo, Rep.Costa RicaCote d'IvoireCroatiaCuracaoCyprusCzech RepublicDenmarkDjiboutiDominicaDominican RepublicEarly-demographic dividendEast Asia & PacificEast Asia & Pacific (excluding high income)East Asia & Pacific (IDA & IBRD countries)EcuadorEgypt, Arab Rep.El SalvadorEquatorial GuineaEritreaEstoniaEthiopiaEuro areaEurope & Central AsiaEurope & Central Asia (excluding high income)Europe & Central Asia (IDA & IBRD countries)European UnionFaroe IslandsFijiFinlandFragile and conflict affected situationsFranceFrench PolynesiaGabonGambia, TheGeorgiaGermanyGhanaGreeceGrenadaGuatemalaGuineaGuinea-BissauGuyanaHaitiHeavily indebted poor countries (HIPC)High incomeHondurasHong Kong SAR, ChinaHungaryIBRD onlyIcelandIDA & IBRD totalIDA blendIDA onlyIDA totalIndiaIndonesiaIran, Islamic Rep.IraqIrelandIsraelItalyJamaicaJapanJordanKazakhstanKenyaKiribatiKorea, Rep.KosovoKuwaitKyrgyz RepublicLao PDRLate-demographic dividendLatin America & Caribbean Latin America & Caribbean (excluding high income)Latin America & the Caribbean (IDA & IBRD countries)LatviaLeast developed countries: UN classificationLebanonLesothoLiberiaLibyaLithuaniaLow & middle incomeLow incomeLower middle incomeLuxembourgMacao SAR, ChinaMacedonia, FYRMadagascarMalawiMalaysiaMaldivesMaliMaltaMarshall IslandsMauritaniaMauritiusMexicoMicronesia, Fed. Sts.Middle East & North Africa (excluding high income)Middle East & North Africa (IDA & IBRD countries)Middle incomeMoldovaMongoliaMontenegroMoroccoMozambiqueMyanmarNamibiaNepalNetherlandsNew CaledoniaNicaraguaNigerNigeriaNorth AmericaNorwayOECD membersOmanOther small statesPacific island small statesPakistanPalauPanamaPapua New GuineaParaguayPeruPhilippinesPolandPortugalPost-demographic dividendPre-demographic dividendQatarRomaniaRussian FederationRwandaSamoaSao Tome and PrincipeSaudi ArabiaSenegalSerbiaSeychellesSierra LeoneSingaporeSint Maarten (Dutch part)Slovak RepublicSloveniaSmall statesSolomon IslandsSouth AfricaSouth AsiaSouth Asia (IDA & IBRD)South SudanSpainSri LankaSt. Kitts and NevisSt. LuciaSt. Vincent and the GrenadinesSub-Saharan Africa Sub-Saharan Africa (excluding high income)Sub-Saharan Africa (IDA & IBRD countries)SudanSurinameSwazilandSwedenSwitzerlandSyrian Arab RepublicTajikistanTanzaniaThailandTimor-LesteTogoTongaTrinidad and TobagoTunisiaTurkeyTuvaluUgandaUkraineUnited KingdomUnited StatesUpper middle incomeUruguayVanuatuVenezuela, RBVietnamWest Bank and GazaWorldYemen, Rep.ZambiaZimbabwe Timeline:
This timeline shows a graph from 1977 to 2016 of Bolivia. No data until 1976. Number of actual observations by date: 40.
Source name:
World Development Indicators
Source organization:
International Monetary Fund, Balance of Payments Statistics Yearbook and data files.
Categories, topics:
Economy & Growth, Trade
Last updated:
apr 23, 2017
Indicators value changes by year
Minimum:
659.4 mln
jan 1, 1977
Maximum:
12.988 bln
jan 1, 2015
At the date of observation
Value
Absolute change
Change from previous value
jan 1, 1977
659.4 mln
+659.4 mln
0.0%
jan 1, 1978
760.9 mln
+101.5 mln
15.39%
jan 1, 1979
948.1 mln
+187.2 mln
24.6%
jan 1, 1980
1.131 bln
+182.8 mln
19.28%
jan 1, 1981
832.9 mln
-298.0 mln
-26.35%
jan 1, 1982
1.147 bln
+314.6 mln
37.77%
jan 1, 1983
717.7 mln
-429.8 mln
-37.46%
jan 1, 1984
740.6 mln
+22.9 mln
3.19%
jan 1, 1985
665.8 mln
-74.8 mln
-10.1%
jan 1, 1986
708.9 mln
+43.1 mln
6.47%
jan 1, 1987
842.3 mln
+133.4 mln
18.82%
jan 1, 1988
916.5 mln
+74.2 mln
8.81%
jan 1, 1989
845.7 mln
-70.8 mln
-7.73%
jan 1, 1990
1.028 bln
+182.0 mln
21.52%
jan 1, 1991
1.086 bln
+58.5 mln
5.69%
jan 1, 1992
1.115 bln
+29.2 mln
2.69%
jan 1, 1993
1.352 bln
+236.4 mln
21.19%
jan 1, 1994
1.433 bln
+81.6 mln
6.04%
jan 1, 1995
1.353 bln
-80.6 mln
-5.62%
jan 1, 1996
1.574 bln
+221.1 mln
16.34%
jan 1, 1997
1.731 bln
+157.52 mln
10.01%
jan 1, 1998
2.062 bln
+330.92 mln
19.11%
jan 1, 1999
2.2 bln
+137.66 mln
6.67%
jan 1, 2000
1.989 bln
-211.3 mln
-9.6%
jan 1, 2001
2.078 bln
+89.14 mln
4.48%
jan 1, 2002
1.979 bln
-98.396 mln
-4.74%
jan 1, 2003
2.072 bln
+92.551 mln
4.68%
jan 1, 2004
2.048 bln
-23.882 mln
-1.15%
jan 1, 2005
2.331 bln
+282.841 mln
13.81%
jan 1, 2006
2.865 bln
+533.591 mln
22.89%
jan 1, 2007
3.457 bln
+592.351 mln
20.68%
jan 1, 2008
4.14 bln
+683.31 mln
19.77%
jan 1, 2009
5.778 bln
+1.638 bln
39.56%
jan 1, 2010
5.156 bln
-622.325 mln
-10.77%
jan 1, 2011
6.156 bln
+999.798 mln
19.39%
jan 1, 2012
8.777 bln
+2.622 bln
42.59%
jan 1, 2013
9.919 bln
+1.142 bln
13.01%
jan 1, 2014
11.061 bln
+1.142 bln
11.51%
jan 1, 2015
12.988 bln
+1.927 bln
17.42%
jan 1, 2016
11.347 bln
-1.641 bln
-12.63%
Ranking of countries by current statistics by years


Comments: