29
/
en
AIzaSyAYiBZKx7MnpbEhh9jyipgxe19OcubqV5w
April 1, 2024
33519
European Union
EUU
false
2
1
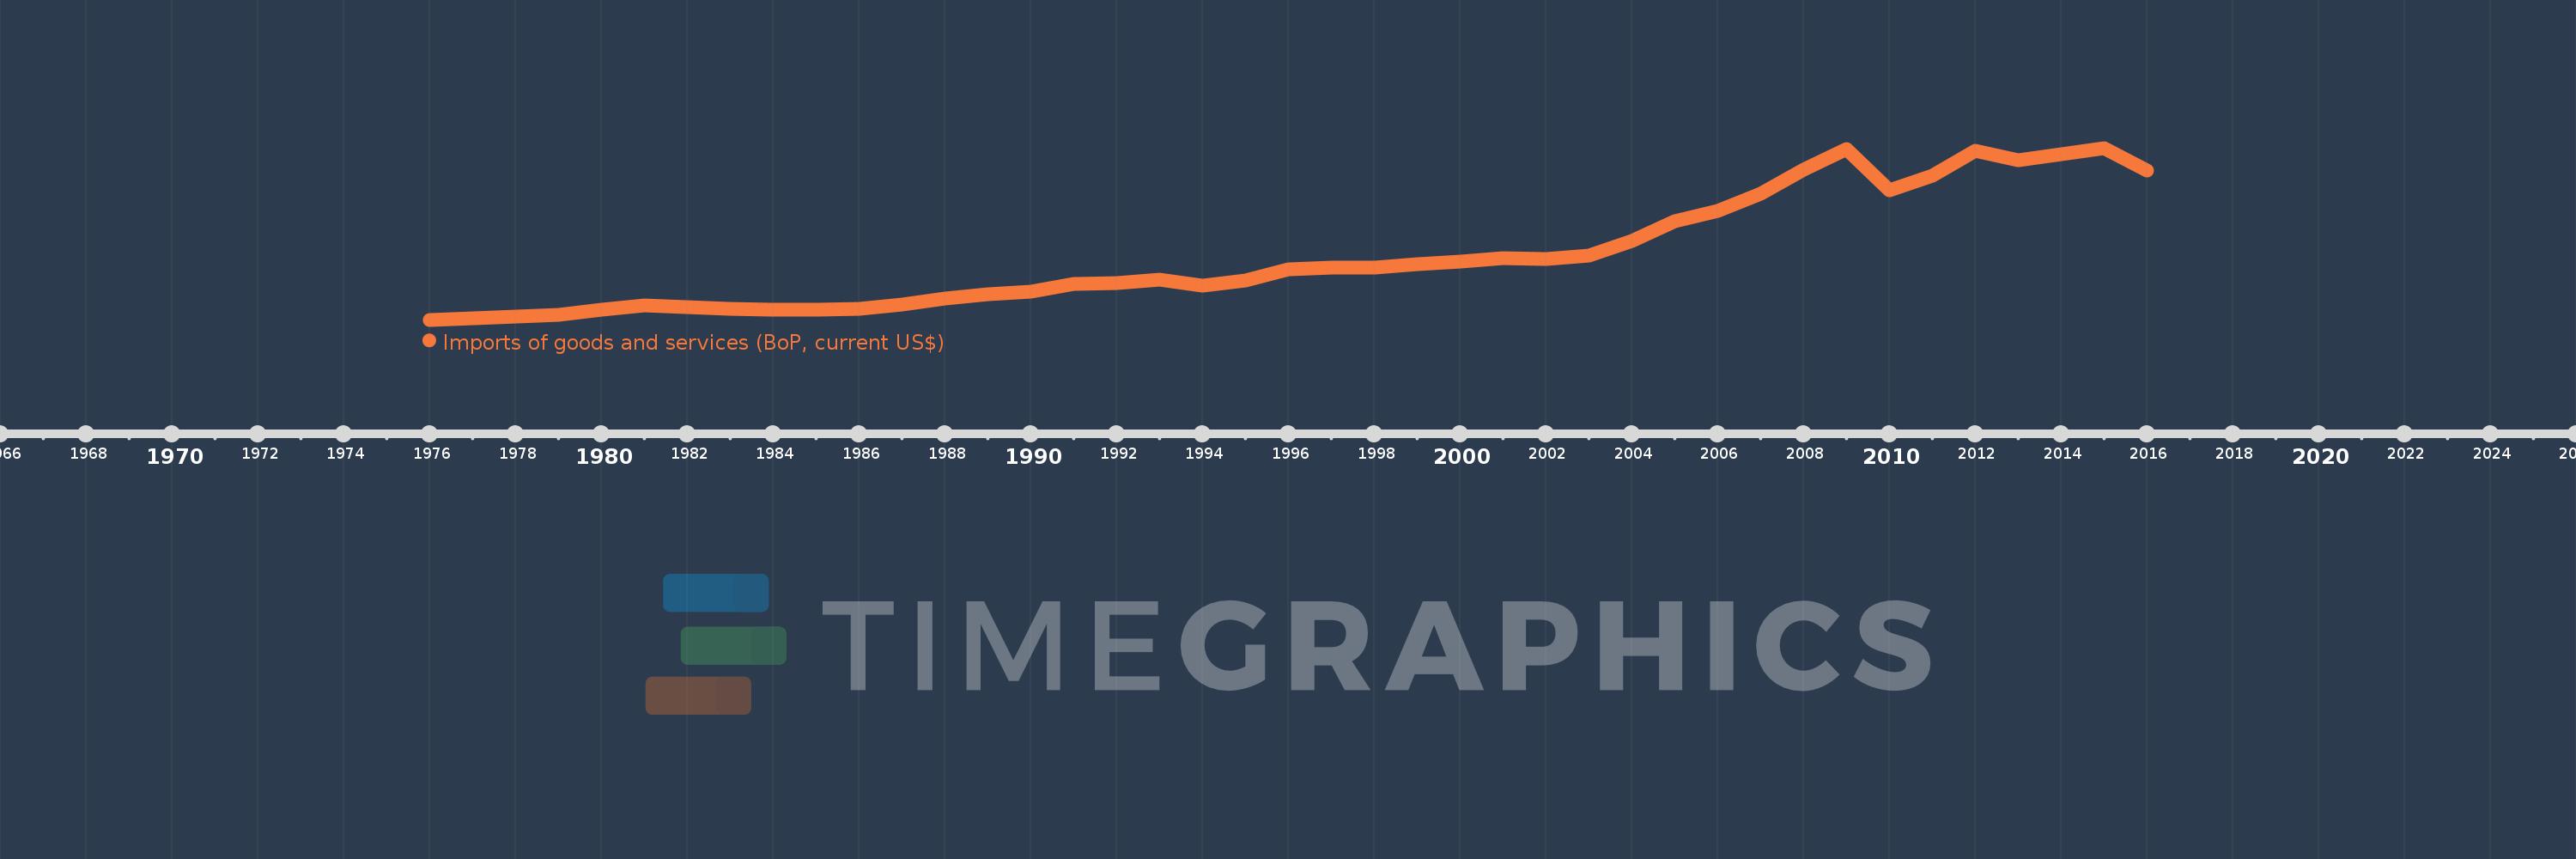
Imports of goods and services (BoP, current US$)
2016,2015,2014,2013,2012,2011,2010,2009,2008,2007,2006,2005,2004,2003,2002,2001,2000,1999,1998,1997,1996,1995,1994,1993,1992,1991,1990,1989,1988,1987,1986,1985,1984,1983,1982,1981,1980,1979,1978,1977,1976
This statistics in other country:
AfghanistanAlbaniaAlgeriaAngolaAntigua and BarbudaArab WorldArgentinaArmeniaArubaAustraliaAustriaAzerbaijanBahamas, TheBahrainBangladeshBarbadosBelarusBelgiumBelizeBeninBermudaBhutanBoliviaBosnia and HerzegovinaBotswanaBrazilBrunei DarussalamBulgariaBurkina FasoBurundiCabo VerdeCambodiaCameroonCanadaCaribbean small statesCentral African RepublicCentral Europe and the BalticsChadChileChinaColombiaComorosCongo, Dem. Rep.Congo, Rep.Costa RicaCote d'IvoireCroatiaCuracaoCyprusCzech RepublicDenmarkDjiboutiDominicaDominican RepublicEarly-demographic dividendEast Asia & PacificEast Asia & Pacific (excluding high income)East Asia & Pacific (IDA & IBRD countries)EcuadorEgypt, Arab Rep.El SalvadorEquatorial GuineaEritreaEstoniaEthiopiaEuro areaEurope & Central AsiaEurope & Central Asia (excluding high income)Europe & Central Asia (IDA & IBRD countries)European UnionFaroe IslandsFijiFinlandFragile and conflict affected situationsFranceFrench PolynesiaGabonGambia, TheGeorgiaGermanyGhanaGreeceGrenadaGuatemalaGuineaGuinea-BissauGuyanaHaitiHeavily indebted poor countries (HIPC)High incomeHondurasHong Kong SAR, ChinaHungaryIBRD onlyIcelandIDA & IBRD totalIDA blendIDA onlyIDA totalIndiaIndonesiaIran, Islamic Rep.IraqIrelandIsraelItalyJamaicaJapanJordanKazakhstanKenyaKiribatiKorea, Rep.KosovoKuwaitKyrgyz RepublicLao PDRLate-demographic dividendLatin America & Caribbean Latin America & Caribbean (excluding high income)Latin America & the Caribbean (IDA & IBRD countries)LatviaLeast developed countries: UN classificationLebanonLesothoLiberiaLibyaLithuaniaLow & middle incomeLow incomeLower middle incomeLuxembourgMacao SAR, ChinaMacedonia, FYRMadagascarMalawiMalaysiaMaldivesMaliMaltaMarshall IslandsMauritaniaMauritiusMexicoMicronesia, Fed. Sts.Middle East & North Africa (excluding high income)Middle East & North Africa (IDA & IBRD countries)Middle incomeMoldovaMongoliaMontenegroMoroccoMozambiqueMyanmarNamibiaNepalNetherlandsNew CaledoniaNicaraguaNigerNigeriaNorth AmericaNorwayOECD membersOmanOther small statesPacific island small statesPakistanPalauPanamaPapua New GuineaParaguayPeruPhilippinesPolandPortugalPost-demographic dividendPre-demographic dividendQatarRomaniaRussian FederationRwandaSamoaSao Tome and PrincipeSaudi ArabiaSenegalSerbiaSeychellesSierra LeoneSingaporeSint Maarten (Dutch part)Slovak RepublicSloveniaSmall statesSolomon IslandsSouth AfricaSouth AsiaSouth Asia (IDA & IBRD)South SudanSpainSri LankaSt. Kitts and NevisSt. LuciaSt. Vincent and the GrenadinesSub-Saharan Africa Sub-Saharan Africa (excluding high income)Sub-Saharan Africa (IDA & IBRD countries)SudanSurinameSwazilandSwedenSwitzerlandSyrian Arab RepublicTajikistanTanzaniaThailandTimor-LesteTogoTongaTrinidad and TobagoTunisiaTurkeyTuvaluUgandaUkraineUnited KingdomUnited StatesUpper middle incomeUruguayVanuatuVenezuela, RBVietnamWest Bank and GazaWorldYemen, Rep.ZambiaZimbabwe Timeline:
This timeline shows a graph from 1976 to 2016 of European Union. No data until 1975. Number of actual observations by date: 41.
Source name:
World Development Indicators
Source organization:
International Monetary Fund, Balance of Payments Statistics Yearbook and data files.
Categories, topics:
Economy & Growth, Trade
Last updated:
apr 23, 2017
Indicators value changes by year
Minimum:
467.278 bln
jan 1, 1976
Maximum:
7.499 trl
jan 1, 2015
At the date of observation
Value
Absolute change
Change from previous value
jan 1, 1976
467.278 bln
+467.278 bln
0.0%
jan 1, 1977
522.366 bln
+55.088 bln
11.79%
jan 1, 1978
583.21 bln
+60.845 bln
11.65%
jan 1, 1979
678.929 bln
+95.719 bln
16.41%
jan 1, 1980
886.645 bln
+207.716 bln
30.59%
jan 1, 1981
1.059 trl
+172.001 bln
19.4%
jan 1, 1982
966.702 bln
-91.944 bln
-8.69%
jan 1, 1983
917.403 bln
-49.299 bln
-5.1%
jan 1, 1984
874.733 bln
-42.671 bln
-4.65%
jan 1, 1985
882.645 bln
+7.913 bln
0.9%
jan 1, 1986
916.221 bln
+33.576 bln
3.8%
jan 1, 1987
1.082 trl
+165.498 bln
18.06%
jan 1, 1988
1.325 trl
+242.99 bln
22.46%
jan 1, 1989
1.495 trl
+170.438 bln
12.87%
jan 1, 1990
1.607 trl
+111.477 bln
7.46%
jan 1, 1991
1.951 trl
+344.147 bln
21.42%
jan 1, 1992
1.979 trl
+28.576 bln
1.46%
jan 1, 1993
2.116 trl
+136.526 bln
6.9%
jan 1, 1994
1.864 trl
-252.26 bln
-11.92%
jan 1, 1995
2.063 trl
+199.41 bln
10.7%
jan 1, 1996
2.514 trl
+450.811 bln
21.85%
jan 1, 1997
2.587 trl
+73.236 bln
2.91%
jan 1, 1998
2.593 trl
+6.165 bln
0.24%
jan 1, 1999
2.745 trl
+151.882 bln
5.86%
jan 1, 2000
2.844 trl
+98.8 bln
3.6%
jan 1, 2001
2.979 trl
+134.929 bln
4.74%
jan 1, 2002
2.969 trl
-9.725 bln
-0.33%
jan 1, 2003
3.1 trl
+131.281 bln
4.42%
jan 1, 2004
3.708 trl
+607.413 bln
19.59%
jan 1, 2005
4.488 trl
+779.838 bln
21.03%
jan 1, 2006
4.933 trl
+444.973 bln
9.92%
jan 1, 2007
5.64 trl
+707.38 bln
14.34%
jan 1, 2008
6.616 trl
+976.216 bln
17.31%
jan 1, 2009
7.448 trl
+832.145 bln
12.58%
jan 1, 2010
5.774 trl
-1.675 trl
-22.48%
jan 1, 2011
6.376 trl
+601.728 bln
10.42%
jan 1, 2012
7.381 trl
+1.005 trl
15.76%
jan 1, 2013
6.986 trl
-394.373 bln
-5.34%
jan 1, 2014
7.235 trl
+249.015 bln
3.56%
jan 1, 2015
7.499 trl
+263.622 bln
3.64%
jan 1, 2016
6.57 trl
-928.434 bln
-12.38%
Ranking of countries by current statistics by years


Comments: