29
/
en
AIzaSyAYiBZKx7MnpbEhh9jyipgxe19OcubqV5w
April 1, 2024
184507
Macedonia, FYR
MKD
true
2
1
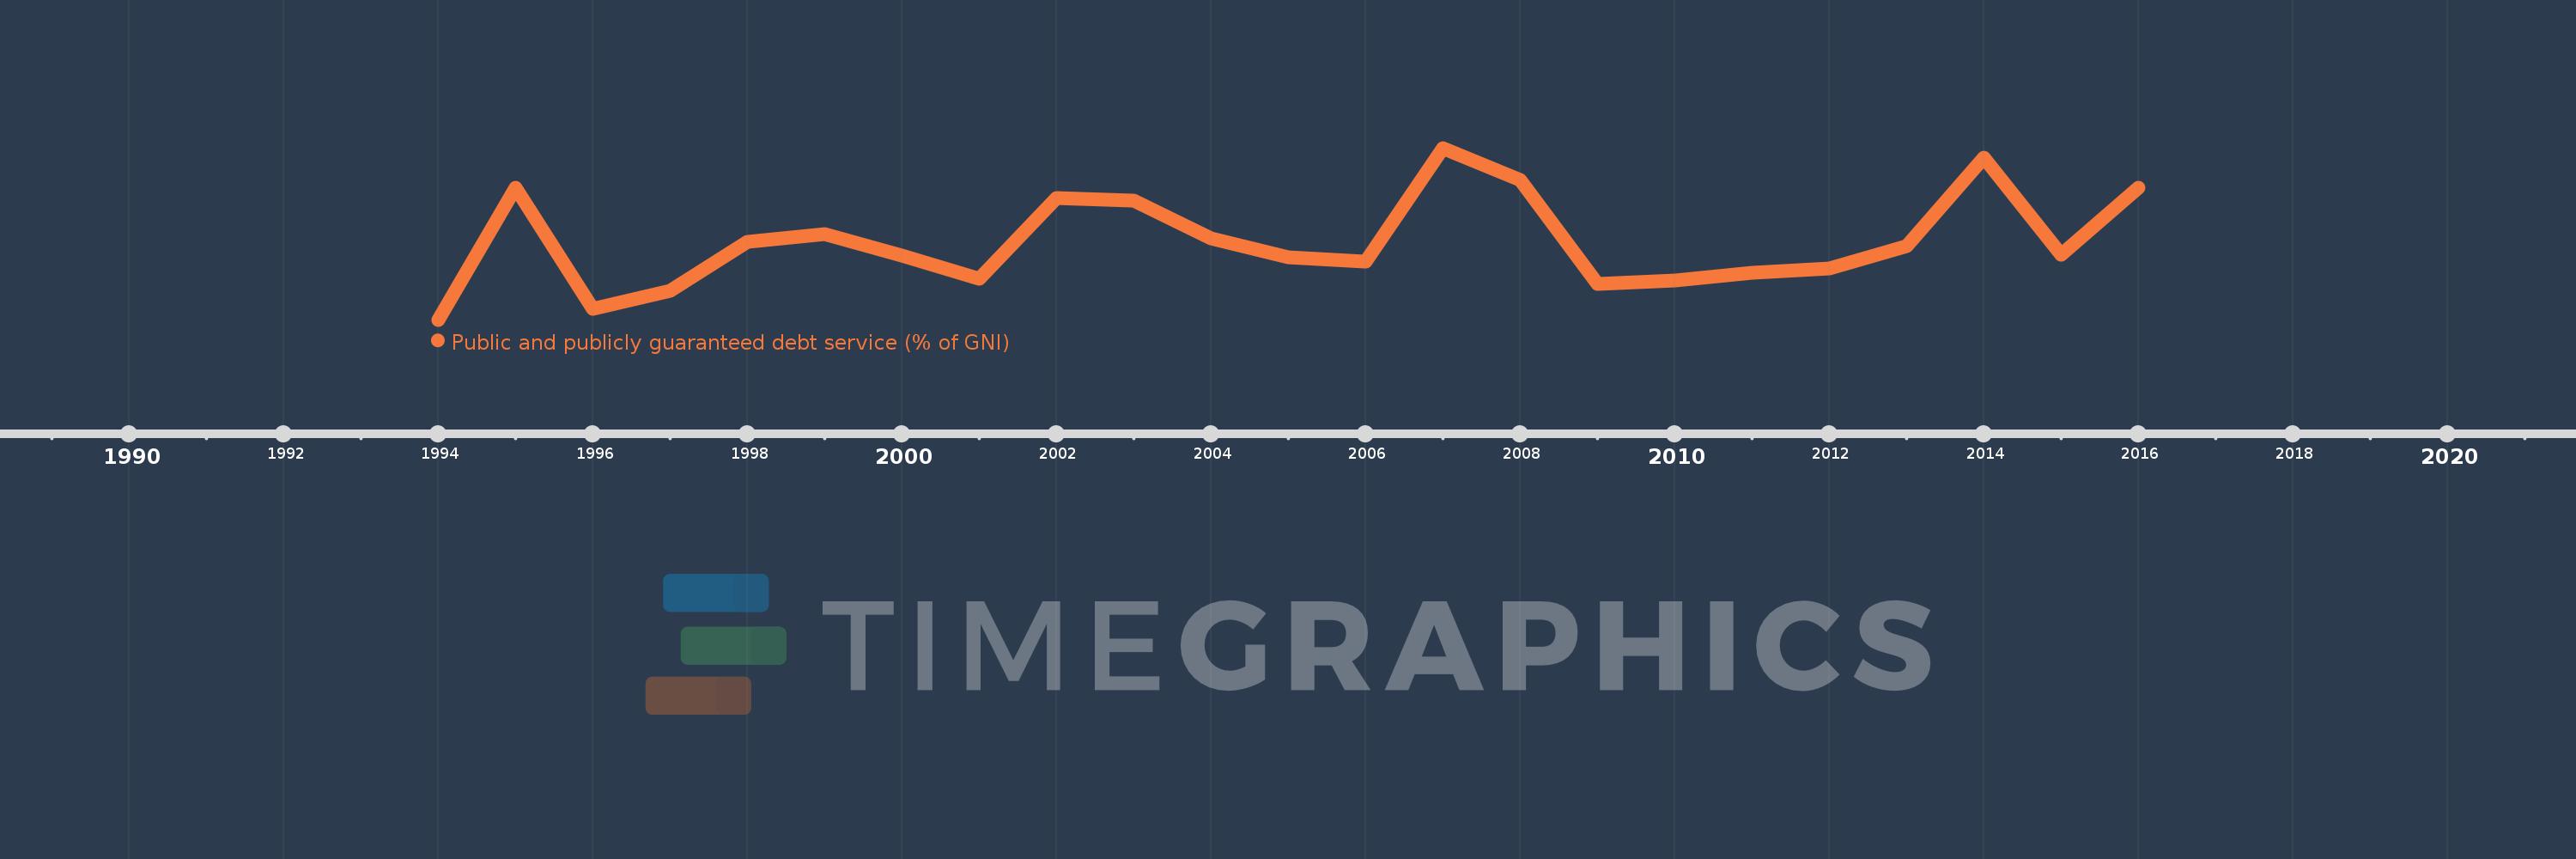
Public and publicly guaranteed debt service (% of GNI)
2016,2015,2014,2013,2012,2011,2010,2009,2008,2007,2006,2005,2004,2003,2002,2001,2000,1999,1998,1997,1996,1995,1994
This statistics in other country:
Timeline:
This timeline shows a graph from 1994 to 2016 of Macedonia, FYR. No data until 1993. Number of actual observations by date: 23.
Source name:
World Development Indicators
Source organization:
World Bank, International Debt Statistics.
Categories, topics:
External Debt
Last updated:
apr 23, 2017
Indicators value changes by year
At the date of observation
Value
Absolute change
Change from previous value
jan 1, 1994
0.315
+0.315
0.0%
jan 1, 1995
4.12
+3.805
1.21K%
jan 1, 1996
0.64
-3.479
-84.46%
jan 1, 1997
1.152
+0.512
79.98%
jan 1, 1998
2.551
+1.398
121.33%
jan 1, 1999
2.785
+0.234
9.18%
jan 1, 2000
2.166
-0.618
-22.21%
jan 1, 2001
1.493
-0.674
-31.1%
jan 1, 2002
3.802
+2.309
154.72%
jan 1, 2003
3.749
-0.053
-1.39%
jan 1, 2004
2.656
-1.093
-29.16%
jan 1, 2005
2.109
-0.547
-20.59%
jan 1, 2006
1.987
-0.122
-5.78%
jan 1, 2007
5.253
+3.266
164.39%
jan 1, 2008
4.337
-0.916
-17.43%
jan 1, 2009
1.353
-2.984
-68.8%
jan 1, 2010
1.445
+0.092
6.8%
jan 1, 2011
1.67
+0.225
15.54%
jan 1, 2012
1.8
+0.131
7.83%
jan 1, 2013
2.441
+0.64
35.55%
jan 1, 2014
4.975
+2.534
103.85%
jan 1, 2015
2.19
-2.785
-55.99%
jan 1, 2016
4.108
+1.918
87.6%
Ranking of countries by current statistics by years


Comments: