29
/
en
AIzaSyAYiBZKx7MnpbEhh9jyipgxe19OcubqV5w
April 1, 2024
163208
Jamaica
JAM
true
2
1
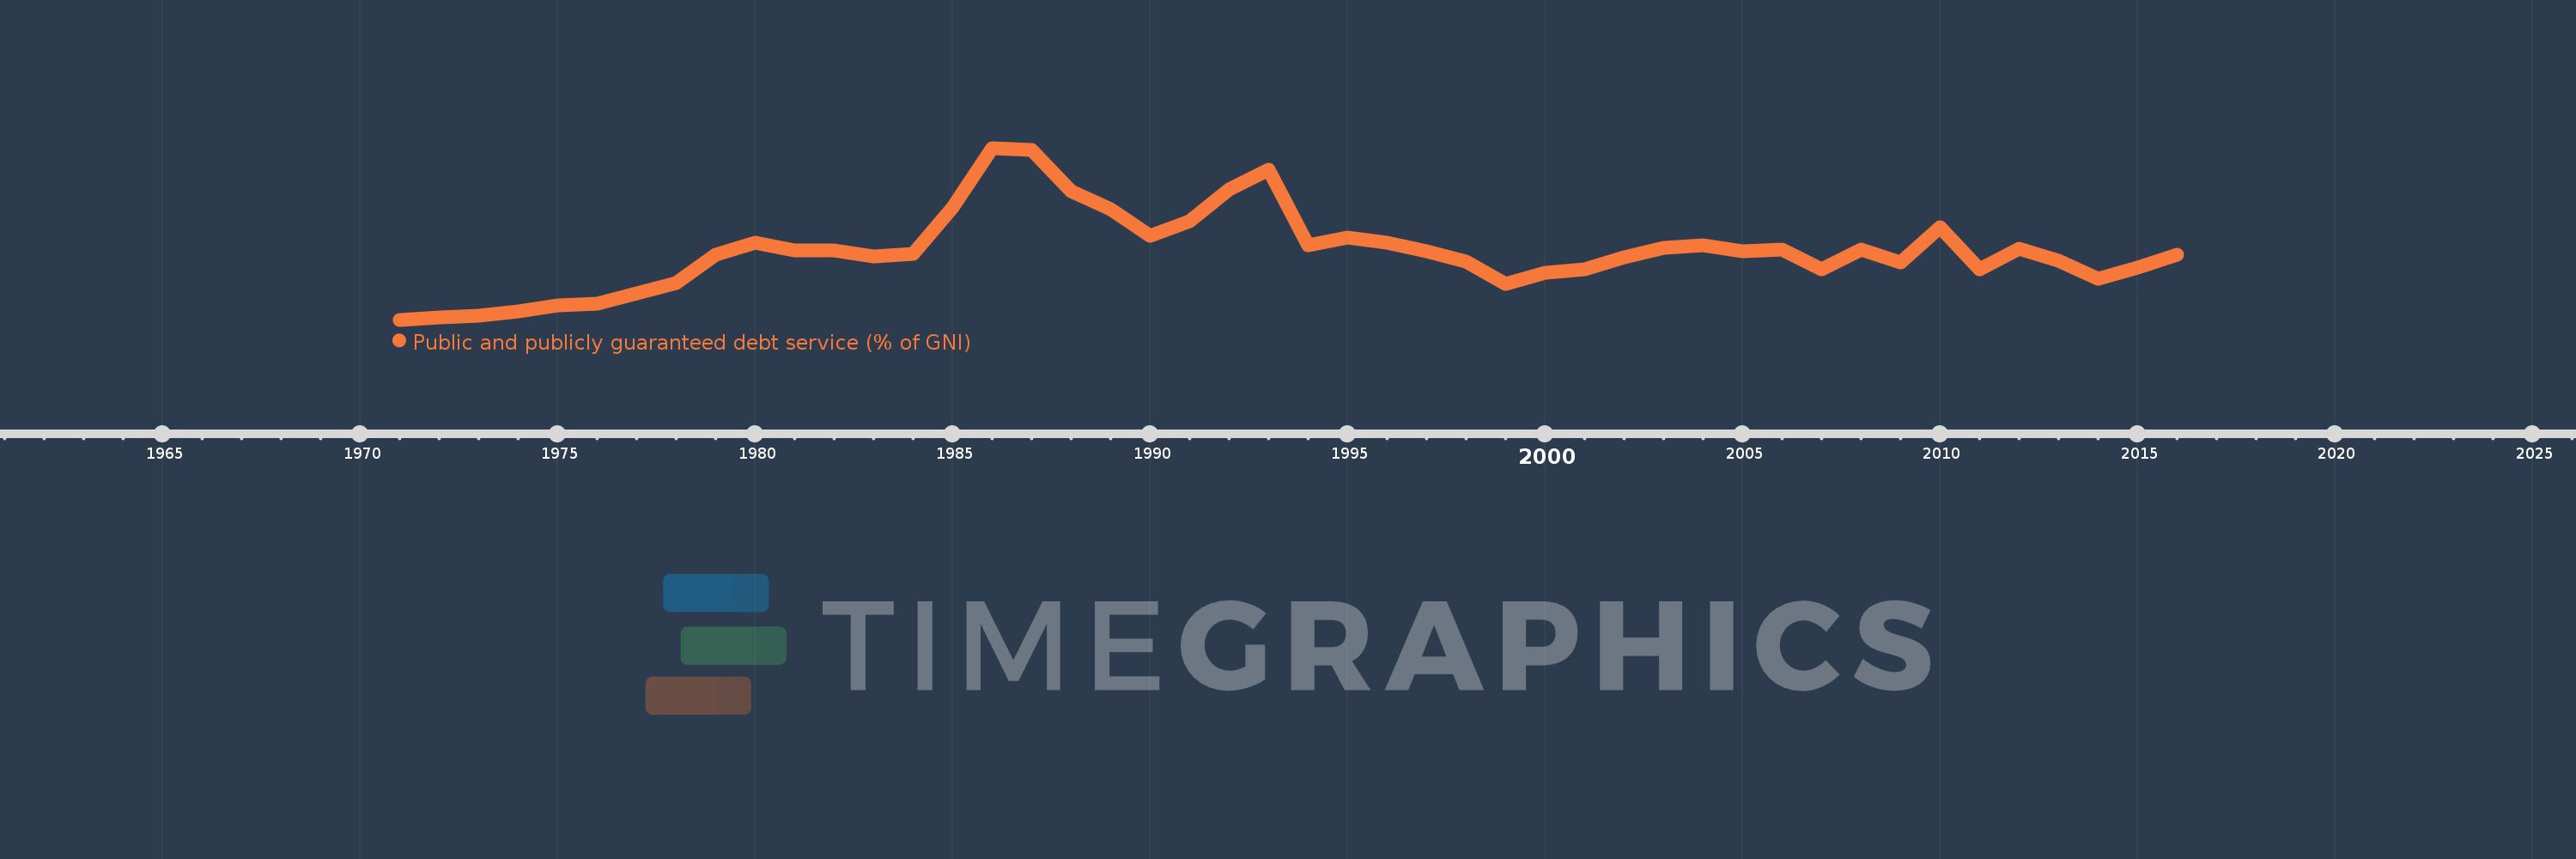
Public and publicly guaranteed debt service (% of GNI)
2016,2015,2014,2013,2012,2011,2010,2009,2008,2007,2006,2005,2004,2003,2002,2001,2000,1999,1998,1997,1996,1995,1994,1993,1992,1991,1990,1989,1988,1987,1986,1985,1984,1983,1982,1981,1980,1979,1978,1977,1976,1975,1974,1973,1972,1971
This statistics in other country:
Timeline:
This timeline shows a graph from 1971 to 2016 of Jamaica. No data until 1970. Number of actual observations by date: 46.
Source name:
World Development Indicators
Source organization:
World Bank, International Debt Statistics.
Categories, topics:
External Debt
Last updated:
apr 23, 2017
Indicators value changes by year
Maximum:
19.422
jan 1, 1986
At the date of observation
Value
Absolute change
Change from previous value
jan 1, 1971
1.136
+1.136
0.0%
jan 1, 1972
1.367
+0.231
20.36%
jan 1, 1973
1.6
+0.232
16.99%
jan 1, 1974
2.063
+0.463
28.95%
jan 1, 1975
2.685
+0.622
30.14%
jan 1, 1976
2.847
+0.163
6.06%
jan 1, 1977
3.919
+1.072
37.64%
jan 1, 1978
5.047
+1.128
28.77%
jan 1, 1979
8.022
+2.975
58.95%
jan 1, 1980
9.352
+1.33
16.58%
jan 1, 1981
8.488
-0.864
-9.24%
jan 1, 1982
8.52
+0.032
0.38%
jan 1, 1983
7.849
-0.671
-7.88%
jan 1, 1984
8.153
+0.304
3.88%
jan 1, 1985
13.117
+4.964
60.88%
jan 1, 1986
19.422
+6.305
48.07%
jan 1, 1987
19.186
-0.236
-1.22%
jan 1, 1988
14.821
-4.365
-22.75%
jan 1, 1989
12.883
-1.938
-13.07%
jan 1, 1990
10.074
-2.809
-21.8%
jan 1, 1991
11.642
+1.568
15.56%
jan 1, 1992
15.05
+3.408
29.28%
jan 1, 1993
17.125
+2.075
13.79%
jan 1, 1994
9.041
-8.084
-47.2%
jan 1, 1995
9.862
+0.82
9.07%
jan 1, 1996
9.365
-0.496
-5.03%
jan 1, 1997
8.426
-0.939
-10.03%
jan 1, 1998
7.368
-1.059
-12.56%
jan 1, 1999
4.929
-2.438
-33.1%
jan 1, 2000
6.149
+1.22
24.75%
jan 1, 2001
6.5
+0.35
5.7%
jan 1, 2002
7.782
+1.283
19.74%
jan 1, 2003
8.759
+0.977
12.56%
jan 1, 2004
9.039
+0.28
3.2%
jan 1, 2005
8.445
-0.595
-6.58%
jan 1, 2006
8.59
+0.145
1.72%
jan 1, 2007
6.501
-2.089
-24.32%
jan 1, 2008
8.612
+2.111
32.47%
jan 1, 2009
7.237
-1.375
-15.96%
jan 1, 2010
10.991
+3.754
51.87%
jan 1, 2011
6.497
-4.493
-40.88%
jan 1, 2012
8.712
+2.214
34.08%
jan 1, 2013
7.452
-1.26
-14.46%
jan 1, 2014
5.522
-1.93
-25.89%
jan 1, 2015
6.709
+1.187
21.5%
jan 1, 2016
8.066
+1.357
20.23%
Ranking of countries by current statistics by years


Comments: