29
/
en
AIzaSyAYiBZKx7MnpbEhh9jyipgxe19OcubqV5w
April 1, 2024
49540
Middle East & North Africa (excluding high income)
MNA
false
2
1
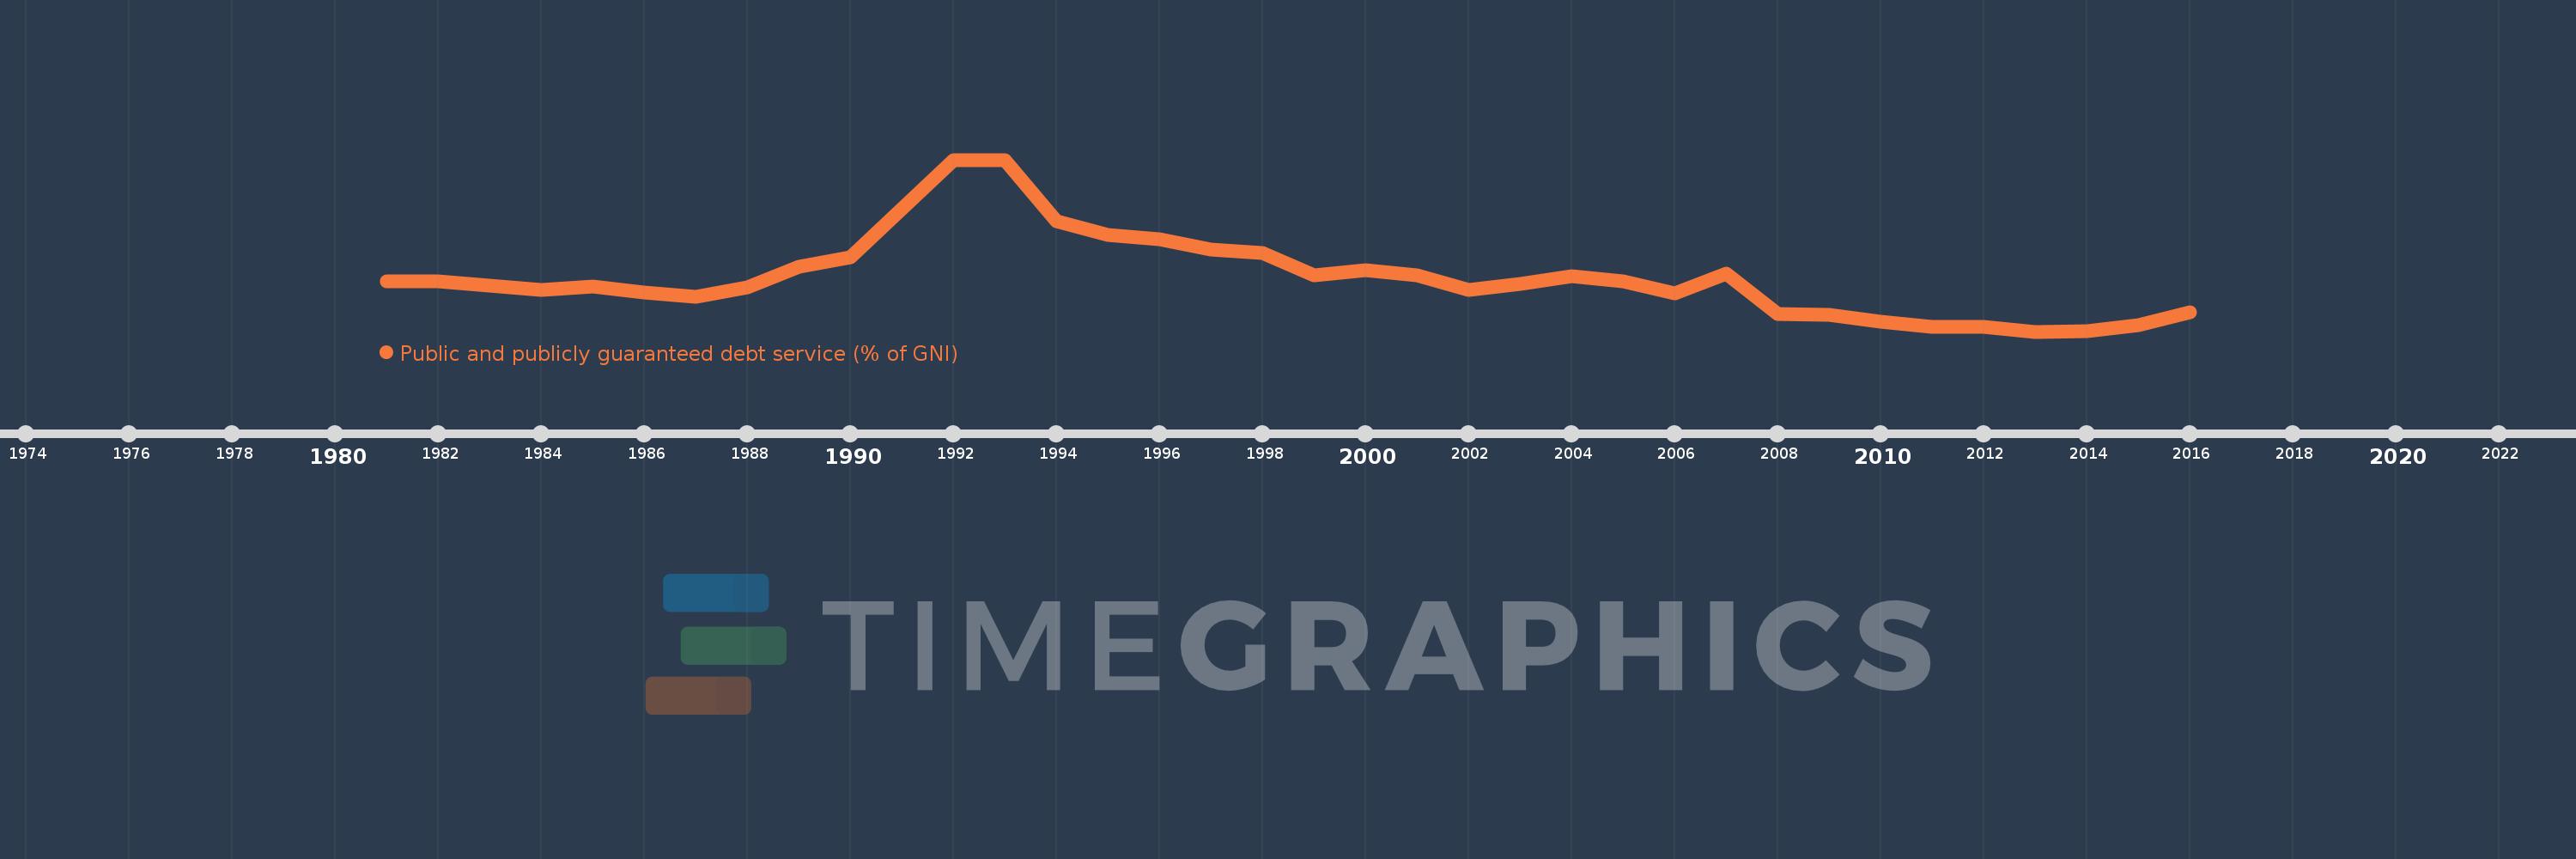
Public and publicly guaranteed debt service (% of GNI)
2016,2015,2014,2013,2012,2011,2010,2009,2008,2007,2006,2005,2004,2003,2002,2001,2000,1999,1998,1997,1996,1995,1994,1993,1992,1990,1989,1988,1987,1986,1985,1984,1983,1982,1981
This statistics in other country:
Timeline:
This timeline shows a graph from 1981 to 2016 of Middle East & North Africa (excluding high income). No data until 1980. Number of actual observations by date: 35.
Source name:
World Development Indicators
Source organization:
World Bank, International Debt Statistics.
Categories, topics:
External Debt
Last updated:
apr 23, 2017
Indicators value changes by year
Maximum:
10.243
jan 1, 1993
At the date of observation
Value
Absolute change
Change from previous value
jan 1, 1981
3.689
+3.689
0.0%
jan 1, 1982
3.714
+0.025
0.68%
jan 1, 1983
3.498
-0.216
-5.82%
jan 1, 1984
3.232
-0.266
-7.6%
jan 1, 1985
3.424
+0.192
5.94%
jan 1, 1986
3.108
-0.316
-9.24%
jan 1, 1987
2.903
-0.205
-6.59%
jan 1, 1988
3.367
+0.464
15.97%
jan 1, 1989
4.484
+1.118
33.19%
jan 1, 1990
4.99
+0.506
11.29%
jan 1, 1992
10.224
+5.233
104.87%
jan 1, 1993
10.243
+0.019
0.19%
jan 1, 1994
6.927
-3.315
-32.37%
jan 1, 1995
6.188
-0.74
-10.68%
jan 1, 1996
5.988
-0.2
-3.23%
jan 1, 1997
5.415
-0.573
-9.56%
jan 1, 1998
5.249
-0.166
-3.07%
jan 1, 1999
4.037
-1.213
-23.1%
jan 1, 2000
4.321
+0.284
7.04%
jan 1, 2001
4.03
-0.29
-6.72%
jan 1, 2002
3.264
-0.766
-19.01%
jan 1, 2003
3.585
+0.321
9.84%
jan 1, 2004
3.991
+0.406
11.31%
jan 1, 2005
3.717
-0.274
-6.86%
jan 1, 2006
3.086
-0.631
-16.99%
jan 1, 2007
4.123
+1.037
33.61%
jan 1, 2008
1.973
-2.15
-52.15%
jan 1, 2009
1.909
-0.064
-3.23%
jan 1, 2010
1.541
-0.368
-19.29%
jan 1, 2011
1.283
-0.258
-16.72%
jan 1, 2012
1.282
-0.001
-0.08%
jan 1, 2013
1.012
-0.27
-21.05%
jan 1, 2014
1.027
+0.014
1.43%
jan 1, 2015
1.353
+0.326
31.75%
jan 1, 2016
2.05
+0.697
51.55%
Ranking of countries by current statistics by years


Comments: