29
/
en
AIzaSyAYiBZKx7MnpbEhh9jyipgxe19OcubqV5w
April 1, 2024
166795
Kazakhstan
KAZ
true
2
1
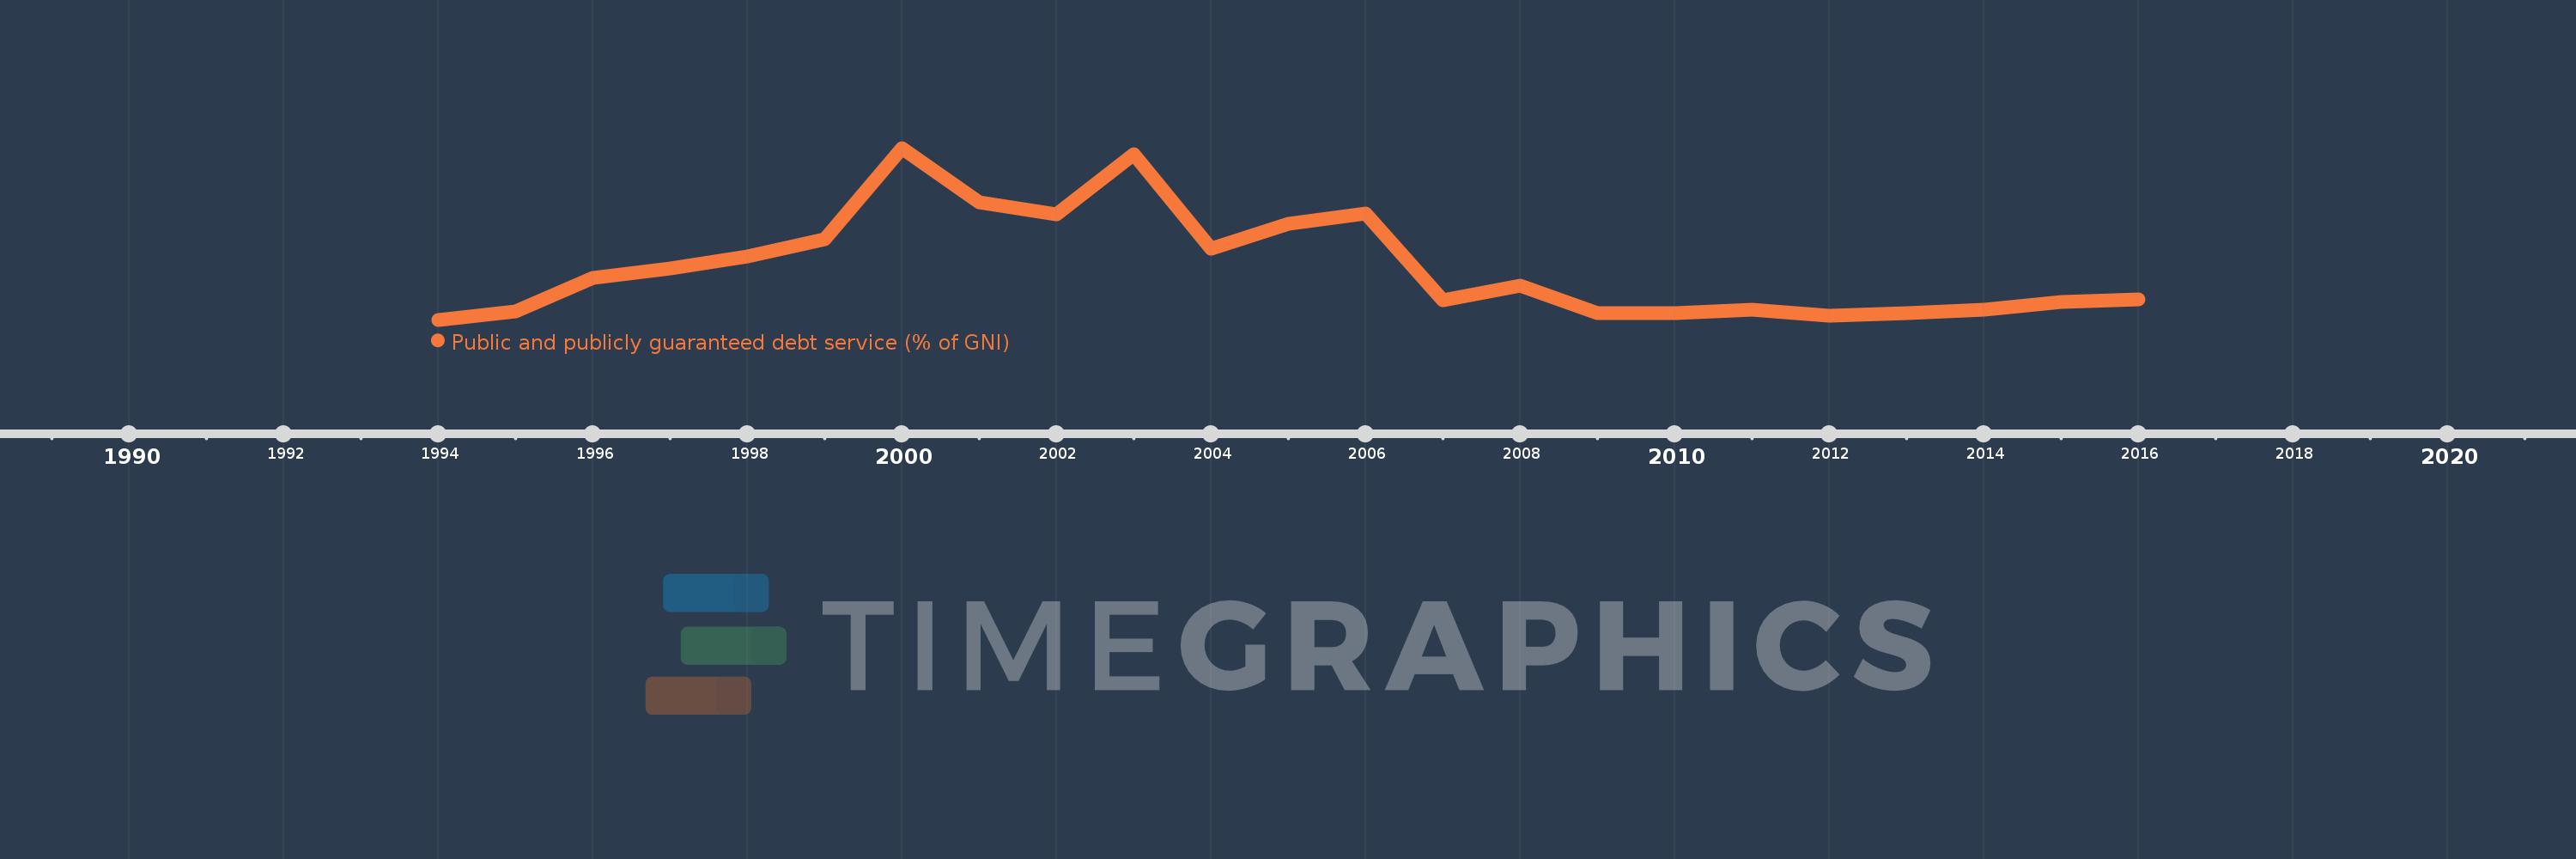
Public and publicly guaranteed debt service (% of GNI)
2016,2015,2014,2013,2012,2011,2010,2009,2008,2007,2006,2005,2004,2003,2002,2001,2000,1999,1998,1997,1996,1995,1994
This statistics in other country:
Timeline:
This timeline shows a graph from 1994 to 2016 of Kazakhstan. No data until 1993. Number of actual observations by date: 23.
Source name:
World Development Indicators
Source organization:
World Bank, International Debt Statistics.
Categories, topics:
External Debt
Last updated:
apr 23, 2017
Indicators value changes by year
At the date of observation
Value
Absolute change
Change from previous value
jan 1, 1994
0.034
+0.034
0.0%
jan 1, 1995
0.223
+0.189
557.88%
jan 1, 1996
0.963
+0.74
332.49%
jan 1, 1997
1.18
+0.217
22.49%
jan 1, 1998
1.444
+0.264
22.4%
jan 1, 1999
1.82
+0.376
26.05%
jan 1, 2000
3.854
+2.034
111.73%
jan 1, 2001
2.649
-1.205
-31.27%
jan 1, 2002
2.387
-0.262
-9.89%
jan 1, 2003
3.712
+1.326
55.54%
jan 1, 2004
1.605
-2.108
-56.78%
jan 1, 2005
2.176
+0.571
35.62%
jan 1, 2006
2.388
+0.212
9.72%
jan 1, 2007
0.469
-1.919
-80.38%
jan 1, 2008
0.8
+0.332
70.83%
jan 1, 2009
0.173
-0.628
-78.42%
jan 1, 2010
0.185
+0.012
6.91%
jan 1, 2011
0.258
+0.074
39.89%
jan 1, 2012
0.118
-0.14
-54.18%
jan 1, 2013
0.183
+0.065
54.85%
jan 1, 2014
0.263
+0.08
43.45%
jan 1, 2015
0.434
+0.171
65.21%
jan 1, 2016
0.492
+0.058
13.35%
Ranking of countries by current statistics by years


Comments: