29
/
en
AIzaSyAYiBZKx7MnpbEhh9jyipgxe19OcubqV5w
April 1, 2024
236416
Senegal
SEN
true
2
1
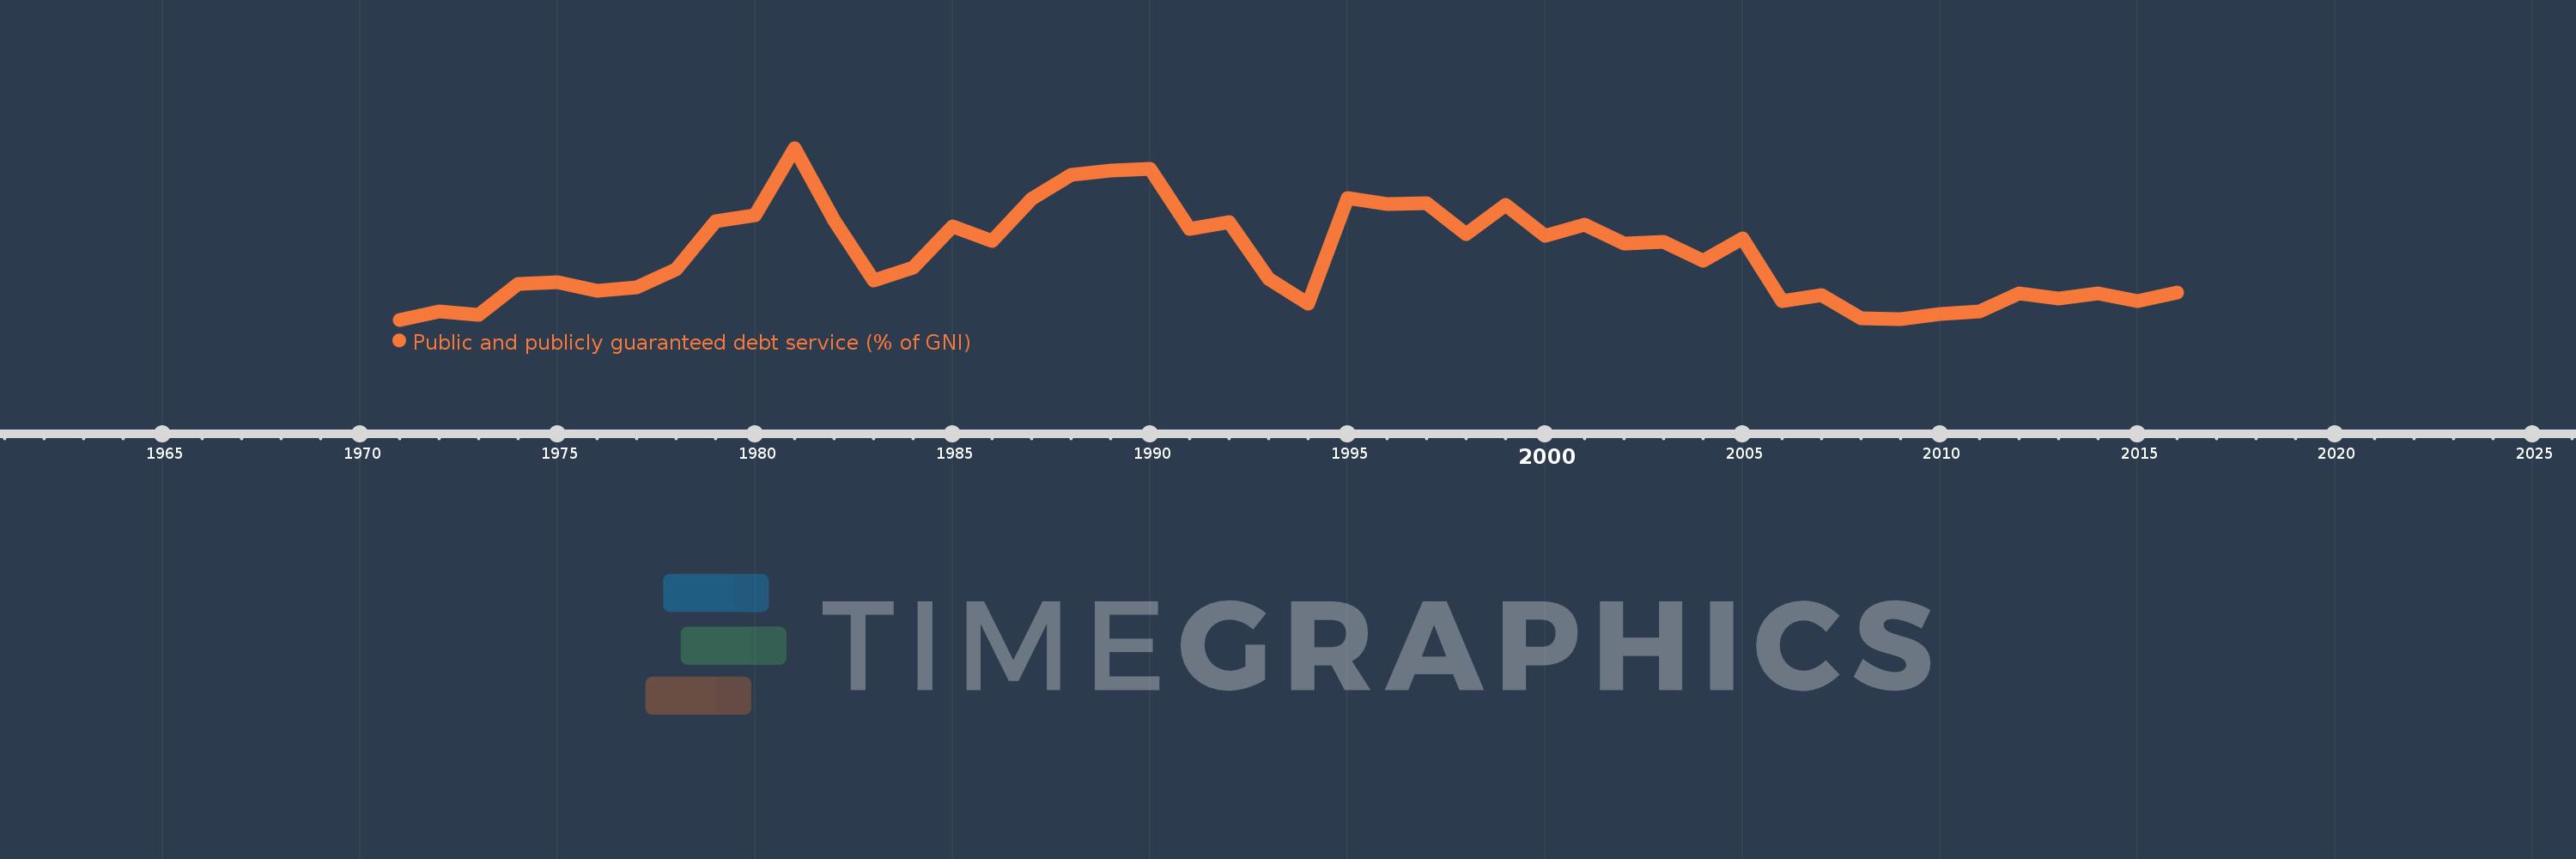
Public and publicly guaranteed debt service (% of GNI)
2016,2015,2014,2013,2012,2011,2010,2009,2008,2007,2006,2005,2004,2003,2002,2001,2000,1999,1998,1997,1996,1995,1994,1993,1992,1991,1990,1989,1988,1987,1986,1985,1984,1983,1982,1981,1980,1979,1978,1977,1976,1975,1974,1973,1972,1971
This statistics in other country:
Timeline:
This timeline shows a graph from 1971 to 2016 of Senegal. No data until 1970. Number of actual observations by date: 46.
Source name:
World Development Indicators
Source organization:
World Bank, International Debt Statistics.
Categories, topics:
External Debt
Last updated:
apr 23, 2017
Indicators value changes by year
At the date of observation
Value
Absolute change
Change from previous value
jan 1, 1971
0.903
+0.903
0.0%
jan 1, 1972
1.164
+0.261
28.85%
jan 1, 1973
1.048
-0.116
-9.93%
jan 1, 1974
2.058
+1.01
96.32%
jan 1, 1975
2.111
+0.053
2.56%
jan 1, 1976
1.83
-0.28
-13.29%
jan 1, 1977
1.941
+0.111
6.04%
jan 1, 1978
2.516
+0.575
29.62%
jan 1, 1979
4.077
+1.562
62.08%
jan 1, 1980
4.274
+0.197
4.83%
jan 1, 1981
6.425
+2.151
50.31%
jan 1, 1982
4.091
-2.333
-36.32%
jan 1, 1983
2.175
-1.917
-46.85%
jan 1, 1984
2.583
+0.408
18.76%
jan 1, 1985
3.914
+1.332
51.56%
jan 1, 1986
3.445
-0.469
-11.98%
jan 1, 1987
4.793
+1.348
39.13%
jan 1, 1988
5.567
+0.773
16.13%
jan 1, 1989
5.699
+0.132
2.38%
jan 1, 1990
5.755
+0.056
0.98%
jan 1, 1991
3.821
-1.934
-33.61%
jan 1, 1992
4.048
+0.227
5.95%
jan 1, 1993
2.223
-1.826
-45.1%
jan 1, 1994
1.406
-0.817
-36.75%
jan 1, 1995
4.817
+3.411
242.65%
jan 1, 1996
4.634
-0.183
-3.81%
jan 1, 1997
4.644
+0.011
0.23%
jan 1, 1998
3.659
-0.985
-21.21%
jan 1, 1999
4.594
+0.934
25.54%
jan 1, 2000
3.593
-1.001
-21.78%
jan 1, 2001
3.973
+0.38
10.58%
jan 1, 2002
3.343
-0.63
-15.86%
jan 1, 2003
3.411
+0.068
2.04%
jan 1, 2004
2.809
-0.603
-17.67%
jan 1, 2005
3.508
+0.7
24.92%
jan 1, 2006
1.494
-2.014
-57.42%
jan 1, 2007
1.703
+0.209
13.97%
jan 1, 2008
0.951
-0.752
-44.15%
jan 1, 2009
0.926
-0.025
-2.66%
jan 1, 2010
1.096
+0.17
18.35%
jan 1, 2011
1.159
+0.063
5.79%
jan 1, 2012
1.741
+0.582
50.19%
jan 1, 2013
1.594
-0.147
-8.45%
jan 1, 2014
1.755
+0.161
10.13%
jan 1, 2015
1.495
-0.26
-14.8%
jan 1, 2016
1.786
+0.291
19.44%
Ranking of countries by current statistics by years


Comments: