29
/
en
AIzaSyAYiBZKx7MnpbEhh9jyipgxe19OcubqV5w
April 1, 2024
29453
East Asia & Pacific (IDA & IBRD countries)
TEA
false
2
1
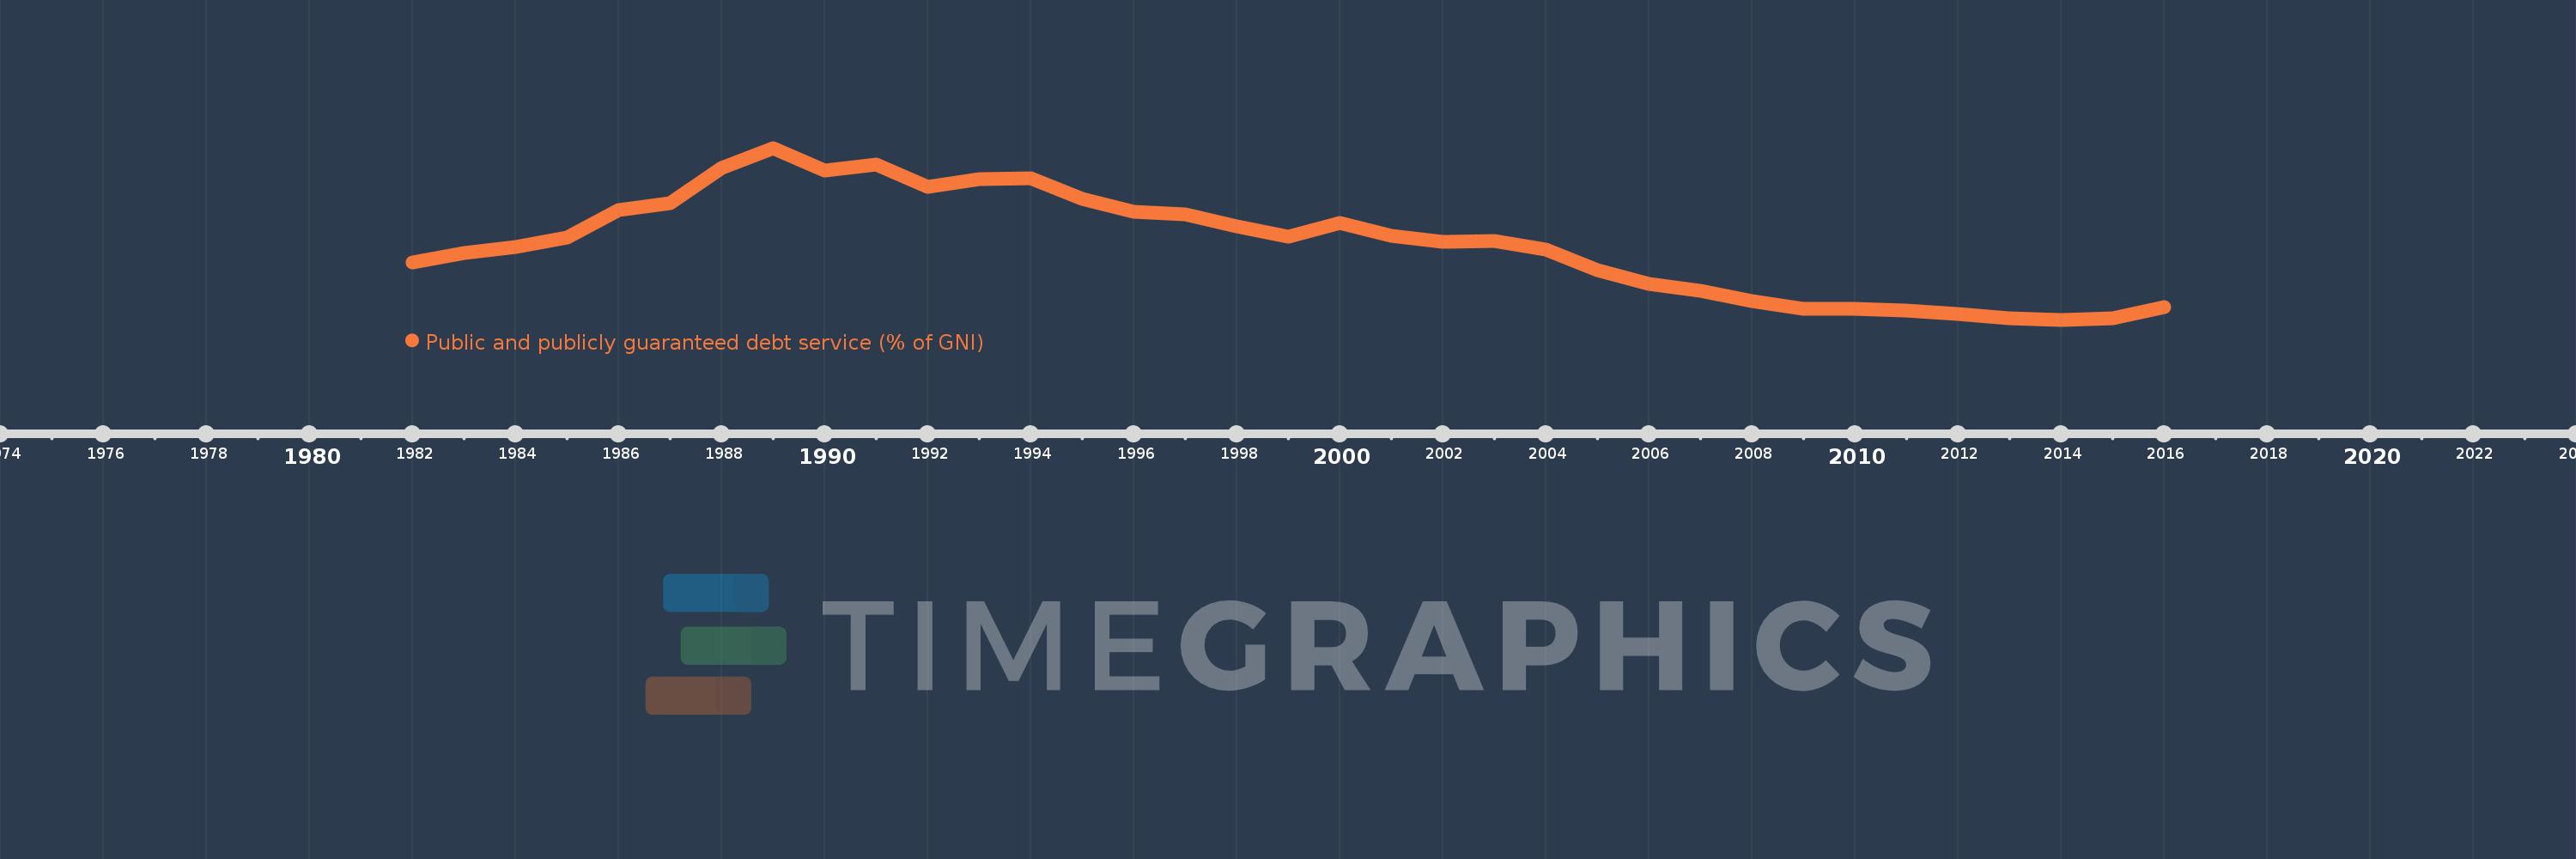
Public and publicly guaranteed debt service (% of GNI)
2016,2015,2014,2013,2012,2011,2010,2009,2008,2007,2006,2005,2004,2003,2002,2001,2000,1999,1998,1997,1996,1995,1994,1993,1992,1991,1990,1989,1988,1987,1986,1985,1984,1983,1982
This statistics in other country:
Timeline:
This timeline shows a graph from 1982 to 2016 of East Asia & Pacific (IDA & IBRD countries). No data until 1981. Number of actual observations by date: 35.
Source name:
World Development Indicators
Source organization:
World Bank, International Debt Statistics.
Categories, topics:
External Debt
Last updated:
apr 23, 2017
Indicators value changes by year
At the date of observation
Value
Absolute change
Change from previous value
jan 1, 1982
1.528
+1.528
0.0%
jan 1, 1983
1.727
+0.199
13.02%
jan 1, 1984
1.852
+0.124
7.2%
jan 1, 1985
2.057
+0.205
11.08%
jan 1, 1986
2.637
+0.58
28.21%
jan 1, 1987
2.785
+0.148
5.62%
jan 1, 1988
3.537
+0.751
26.98%
jan 1, 1989
3.971
+0.435
12.29%
jan 1, 1990
3.494
-0.477
-12.02%
jan 1, 1991
3.613
+0.119
3.4%
jan 1, 1992
3.133
-0.479
-13.27%
jan 1, 1993
3.302
+0.169
5.38%
jan 1, 1994
3.326
+0.024
0.72%
jan 1, 1995
2.889
-0.437
-13.14%
jan 1, 1996
2.614
-0.274
-9.5%
jan 1, 1997
2.559
-0.056
-2.13%
jan 1, 1998
2.288
-0.27
-10.57%
jan 1, 1999
2.083
-0.205
-8.98%
jan 1, 2000
2.369
+0.286
13.74%
jan 1, 2001
2.094
-0.275
-11.6%
jan 1, 2002
1.973
-0.121
-5.76%
jan 1, 2003
1.974
+0.001
0.03%
jan 1, 2004
1.807
-0.167
-8.46%
jan 1, 2005
1.363
-0.444
-24.58%
jan 1, 2006
1.072
-0.291
-21.35%
jan 1, 2007
0.921
-0.151
-14.11%
jan 1, 2008
0.695
-0.225
-24.47%
jan 1, 2009
0.536
-0.159
-22.92%
jan 1, 2010
0.538
+0.002
0.44%
jan 1, 2011
0.488
-0.05
-9.32%
jan 1, 2012
0.419
-0.069
-14.14%
jan 1, 2013
0.329
-0.091
-21.61%
jan 1, 2014
0.299
-0.029
-8.96%
jan 1, 2015
0.325
+0.026
8.66%
jan 1, 2016
0.564
+0.239
73.62%
Ranking of countries by current statistics by years


Comments: