29
/
en
AIzaSyAYiBZKx7MnpbEhh9jyipgxe19OcubqV5w
April 1, 2024
168143
Kenya
KEN
true
2
1
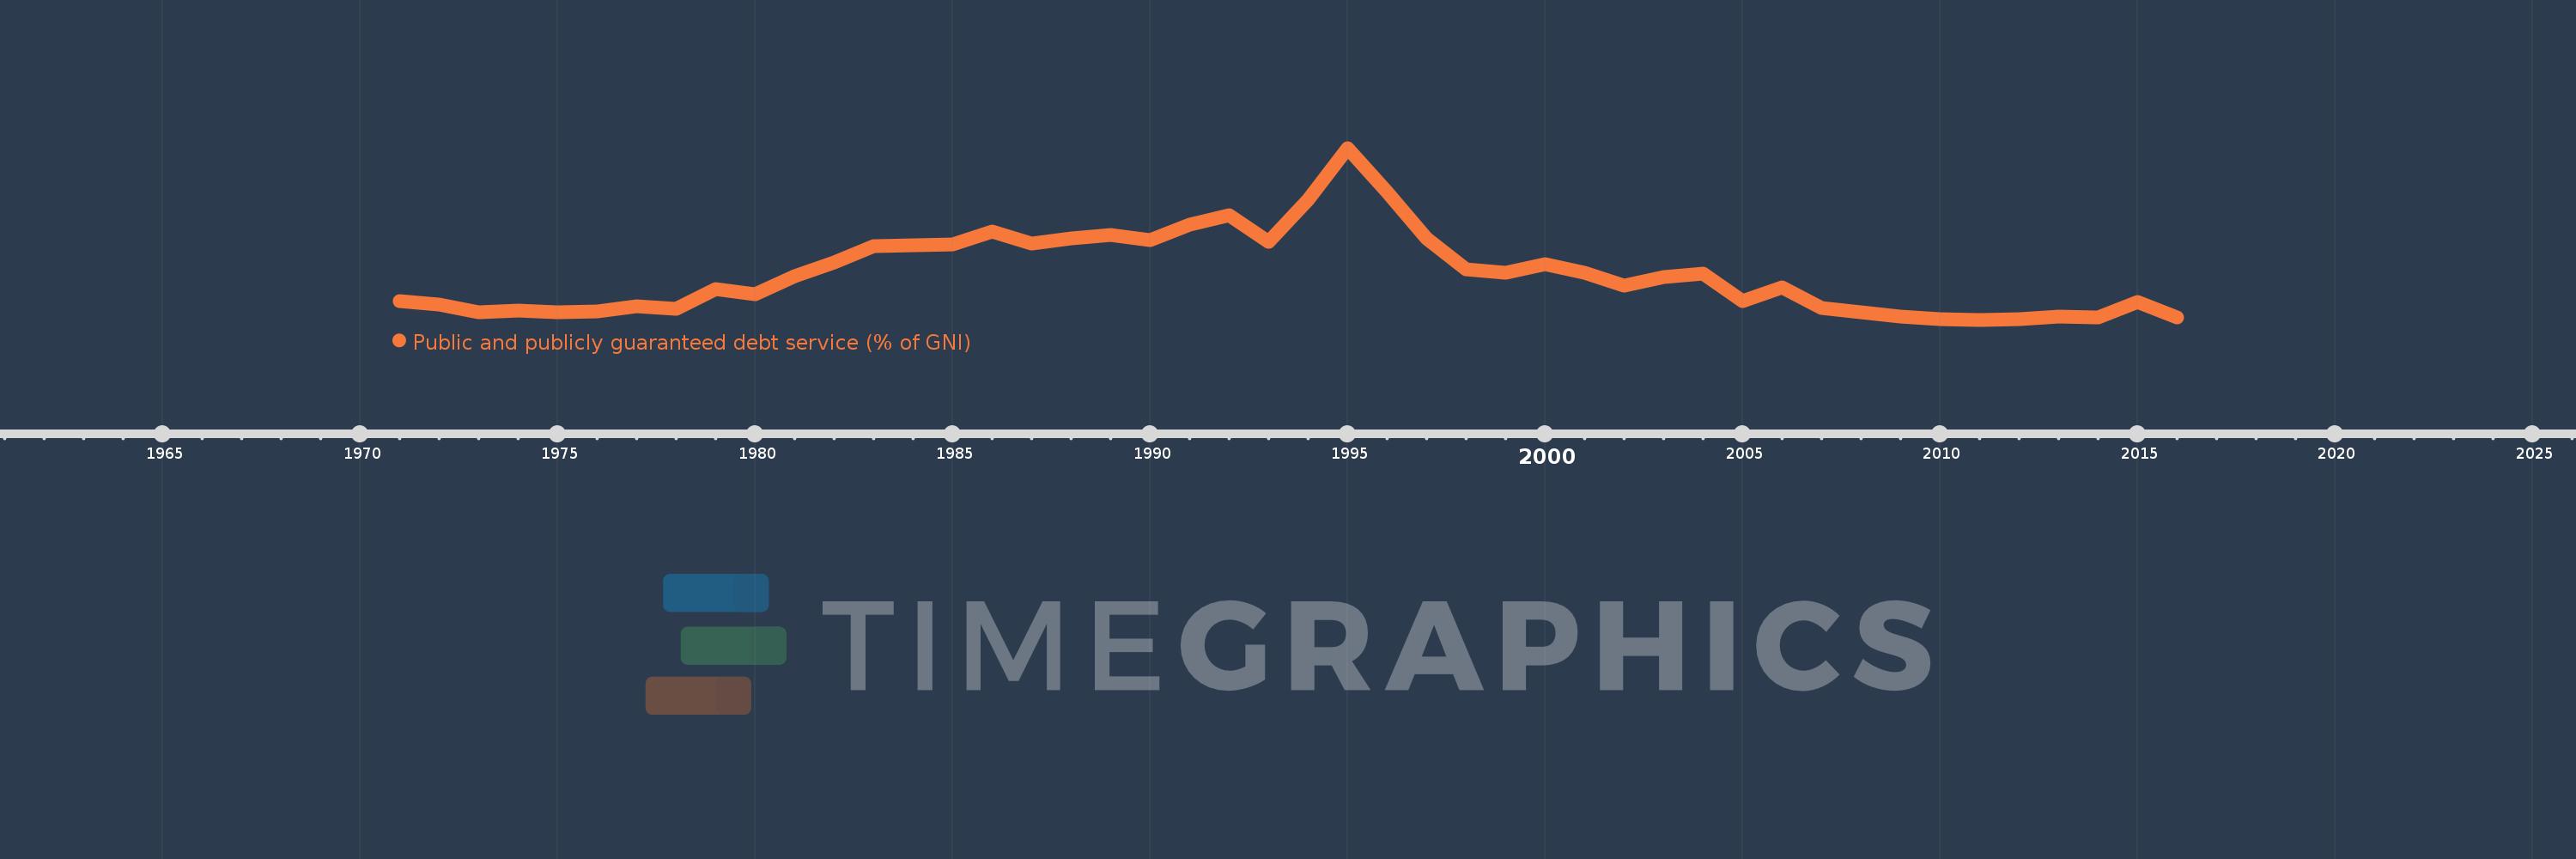
Public and publicly guaranteed debt service (% of GNI)
2016,2015,2014,2013,2012,2011,2010,2009,2008,2007,2006,2005,2004,2003,2002,2001,2000,1999,1998,1997,1996,1995,1994,1993,1992,1991,1990,1989,1988,1987,1986,1985,1984,1983,1982,1981,1980,1979,1978,1977,1976,1975,1974,1973,1972,1971
This statistics in other country:
Timeline:
This timeline shows a graph from 1971 to 2016 of Kenya. No data until 1970. Number of actual observations by date: 46.
Source name:
World Development Indicators
Source organization:
World Bank, International Debt Statistics.
Categories, topics:
External Debt
Last updated:
apr 23, 2017
Indicators value changes by year
At the date of observation
Value
Absolute change
Change from previous value
jan 1, 1971
1.904
+1.904
0.0%
jan 1, 1972
1.713
-0.19
-10.0%
jan 1, 1973
1.28
-0.433
-25.26%
jan 1, 1974
1.38
+0.099
7.74%
jan 1, 1975
1.302
-0.078
-5.64%
jan 1, 1976
1.36
+0.058
4.44%
jan 1, 1977
1.642
+0.282
20.75%
jan 1, 1978
1.467
-0.175
-10.65%
jan 1, 1979
2.578
+1.111
75.71%
jan 1, 1980
2.284
-0.294
-11.4%
jan 1, 1981
3.291
+1.007
44.09%
jan 1, 1982
4.097
+0.806
24.51%
jan 1, 1983
4.983
+0.886
21.63%
jan 1, 1984
5.034
+0.051
1.03%
jan 1, 1985
5.103
+0.069
1.37%
jan 1, 1986
5.818
+0.715
14.01%
jan 1, 1987
5.122
-0.696
-11.97%
jan 1, 1988
5.433
+0.312
6.09%
jan 1, 1989
5.633
+0.2
3.68%
jan 1, 1990
5.325
-0.308
-5.46%
jan 1, 1991
6.181
+0.856
16.07%
jan 1, 1992
6.709
+0.528
8.54%
jan 1, 1993
5.253
-1.456
-21.7%
jan 1, 1994
7.593
+2.34
44.54%
jan 1, 1995
10.49
+2.897
38.15%
jan 1, 1996
8.031
-2.459
-23.44%
jan 1, 1997
5.443
-2.589
-32.23%
jan 1, 1998
3.687
-1.756
-32.26%
jan 1, 1999
3.505
-0.182
-4.94%
jan 1, 2000
4.007
+0.503
14.34%
jan 1, 2001
3.522
-0.486
-12.12%
jan 1, 2002
2.764
-0.758
-21.51%
jan 1, 2003
3.26
+0.495
17.92%
jan 1, 2004
3.463
+0.204
6.24%
jan 1, 2005
1.904
-1.559
-45.01%
jan 1, 2006
2.683
+0.778
40.87%
jan 1, 2007
1.52
-1.163
-43.35%
jan 1, 2008
1.302
-0.218
-14.32%
jan 1, 2009
1.059
-0.243
-18.67%
jan 1, 2010
0.931
-0.128
-12.05%
jan 1, 2011
0.878
-0.053
-5.74%
jan 1, 2012
0.911
+0.033
3.74%
jan 1, 2013
1.05
+0.139
15.27%
jan 1, 2014
1.028
-0.022
-2.11%
jan 1, 2015
1.879
+0.851
82.84%
jan 1, 2016
0.992
-0.887
-47.21%
Ranking of countries by current statistics by years


Comments: