29
/
en
AIzaSyAYiBZKx7MnpbEhh9jyipgxe19OcubqV5w
April 1, 2024
131103
Ethiopia
ETH
true
2
1
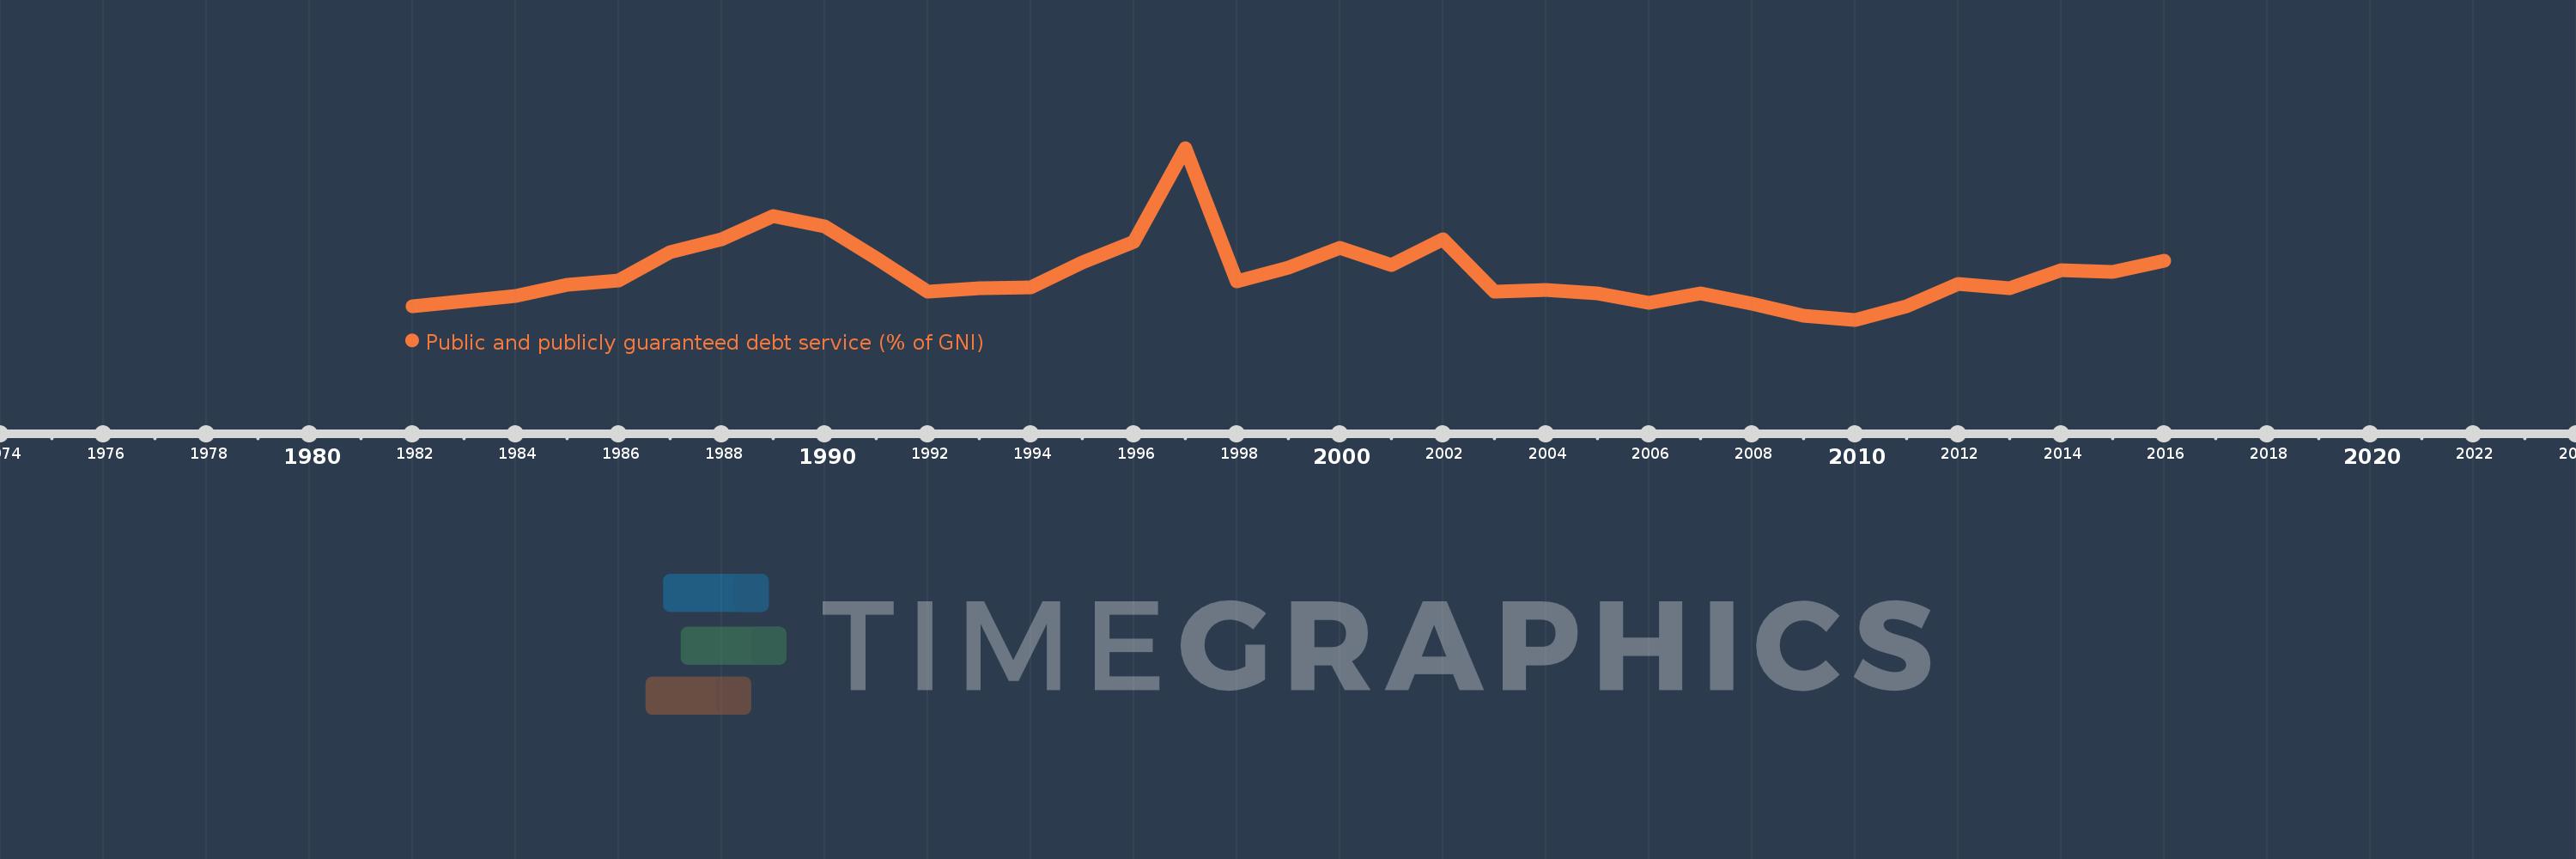
Public and publicly guaranteed debt service (% of GNI)
2016,2015,2014,2013,2012,2011,2010,2009,2008,2007,2006,2005,2004,2003,2002,2001,2000,1999,1998,1997,1996,1995,1994,1993,1992,1991,1990,1989,1988,1987,1986,1985,1984,1983,1982
This statistics in other country:
Timeline:
This timeline shows a graph from 1982 to 2016 of Ethiopia. No data until 1981. Number of actual observations by date: 35.
Source name:
World Development Indicators
Source organization:
World Bank, International Debt Statistics.
Categories, topics:
External Debt
Last updated:
apr 23, 2017
Indicators value changes by year
At the date of observation
Value
Absolute change
Change from previous value
jan 1, 1982
0.608
+0.608
0.0%
jan 1, 1983
0.731
+0.123
20.19%
jan 1, 1984
0.842
+0.111
15.22%
jan 1, 1985
1.08
+0.237
28.17%
jan 1, 1986
1.171
+0.091
8.42%
jan 1, 1987
1.8
+0.63
53.77%
jan 1, 1988
2.078
+0.278
15.44%
jan 1, 1989
2.587
+0.509
24.47%
jan 1, 1990
2.364
-0.223
-8.63%
jan 1, 1991
1.659
-0.705
-29.81%
jan 1, 1992
0.929
-0.73
-44.02%
jan 1, 1993
1.001
+0.073
7.82%
jan 1, 1994
1.029
+0.027
2.73%
jan 1, 1995
1.575
+0.546
53.07%
jan 1, 1996
2.011
+0.437
27.73%
jan 1, 1997
4.075
+2.063
102.6%
jan 1, 1998
1.16
-2.914
-71.52%
jan 1, 1999
1.459
+0.298
25.7%
jan 1, 2000
1.885
+0.426
29.2%
jan 1, 2001
1.508
-0.377
-19.99%
jan 1, 2002
2.075
+0.567
37.63%
jan 1, 2003
0.936
-1.139
-54.9%
jan 1, 2004
0.959
+0.023
2.5%
jan 1, 2005
0.885
-0.074
-7.74%
jan 1, 2006
0.689
-0.196
-22.1%
jan 1, 2007
0.892
+0.203
29.37%
jan 1, 2008
0.67
-0.222
-24.92%
jan 1, 2009
0.408
-0.262
-39.12%
jan 1, 2010
0.315
-0.092
-22.66%
jan 1, 2011
0.601
+0.286
90.7%
jan 1, 2012
1.098
+0.497
82.59%
jan 1, 2013
0.998
-0.101
-9.15%
jan 1, 2014
1.393
+0.395
39.6%
jan 1, 2015
1.364
-0.028
-2.03%
jan 1, 2016
1.605
+0.24
17.61%
Ranking of countries by current statistics by years


Comments: