29
/
en
AIzaSyAYiBZKx7MnpbEhh9jyipgxe19OcubqV5w
April 1, 2024
37738
IDA & IBRD total
IBT
false
2
1
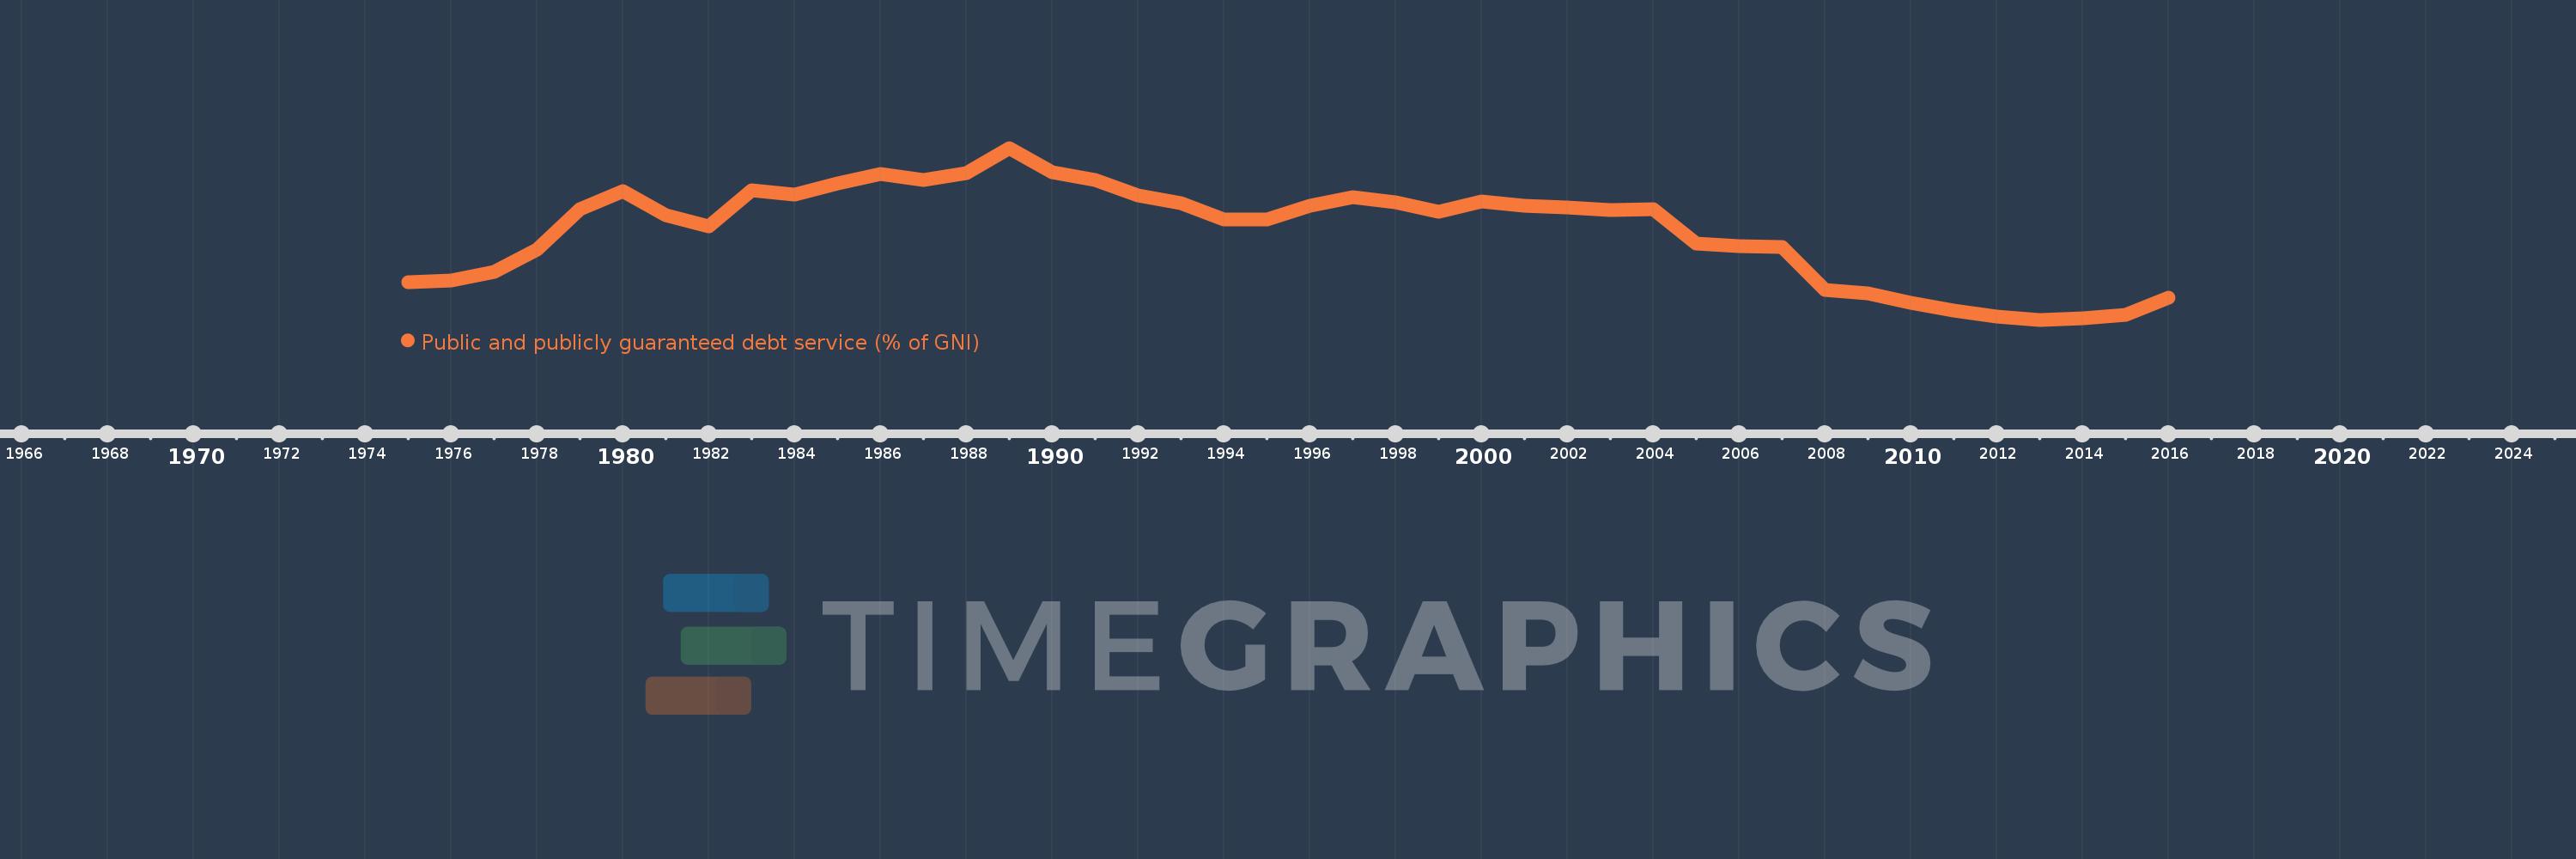
Public and publicly guaranteed debt service (% of GNI)
2016,2015,2014,2013,2012,2011,2010,2009,2008,2007,2006,2005,2004,2003,2002,2001,2000,1999,1998,1997,1996,1995,1994,1993,1992,1991,1990,1989,1988,1987,1986,1985,1984,1983,1982,1981,1980,1979,1978,1977,1976,1975
This statistics in other country:
Timeline:
This timeline shows a graph from 1975 to 2016 of IDA & IBRD total. No data until 1974. Number of actual observations by date: 42.
Source name:
World Development Indicators
Source organization:
World Bank, International Debt Statistics.
Categories, topics:
External Debt
Last updated:
apr 23, 2017
Indicators value changes by year
At the date of observation
Value
Absolute change
Change from previous value
jan 1, 1975
1.48
+1.48
0.0%
jan 1, 1976
1.506
+0.026
1.74%
jan 1, 1977
1.678
+0.172
11.41%
jan 1, 1978
2.092
+0.414
24.69%
jan 1, 1979
2.862
+0.77
36.79%
jan 1, 1980
3.199
+0.338
11.8%
jan 1, 1981
2.753
-0.446
-13.95%
jan 1, 1982
2.536
-0.217
-7.87%
jan 1, 1983
3.221
+0.685
27.01%
jan 1, 1984
3.13
-0.092
-2.85%
jan 1, 1985
3.352
+0.222
7.1%
jan 1, 1986
3.521
+0.169
5.05%
jan 1, 1987
3.418
-0.103
-2.92%
jan 1, 1988
3.544
+0.125
3.66%
jan 1, 1989
4.019
+0.475
13.42%
jan 1, 1990
3.554
-0.465
-11.56%
jan 1, 1991
3.418
-0.136
-3.83%
jan 1, 1992
3.128
-0.291
-8.5%
jan 1, 1993
2.978
-0.149
-4.77%
jan 1, 1994
2.659
-0.319
-10.72%
jan 1, 1995
2.666
+0.007
0.26%
jan 1, 1996
2.919
+0.252
9.47%
jan 1, 1997
3.088
+0.169
5.8%
jan 1, 1998
2.984
-0.104
-3.37%
jan 1, 1999
2.808
-0.176
-5.9%
jan 1, 2000
3.013
+0.205
7.3%
jan 1, 2001
2.925
-0.087
-2.89%
jan 1, 2002
2.887
-0.039
-1.33%
jan 1, 2003
2.848
-0.039
-1.34%
jan 1, 2004
2.857
+0.009
0.32%
jan 1, 2005
2.21
-0.647
-22.66%
jan 1, 2006
2.167
-0.042
-1.92%
jan 1, 2007
2.152
-0.015
-0.7%
jan 1, 2008
1.333
-0.819
-38.07%
jan 1, 2009
1.265
-0.068
-5.11%
jan 1, 2010
1.088
-0.176
-13.95%
jan 1, 2011
0.942
-0.146
-13.41%
jan 1, 2012
0.838
-0.104
-11.07%
jan 1, 2013
0.772
-0.066
-7.9%
jan 1, 2014
0.803
+0.031
4.0%
jan 1, 2015
0.863
+0.06
7.51%
jan 1, 2016
1.185
+0.322
37.28%
Ranking of countries by current statistics by years


Comments: