29
/
en
AIzaSyAYiBZKx7MnpbEhh9jyipgxe19OcubqV5w
April 1, 2024
110296
Congo, Dem. Rep.
COD
true
2
1
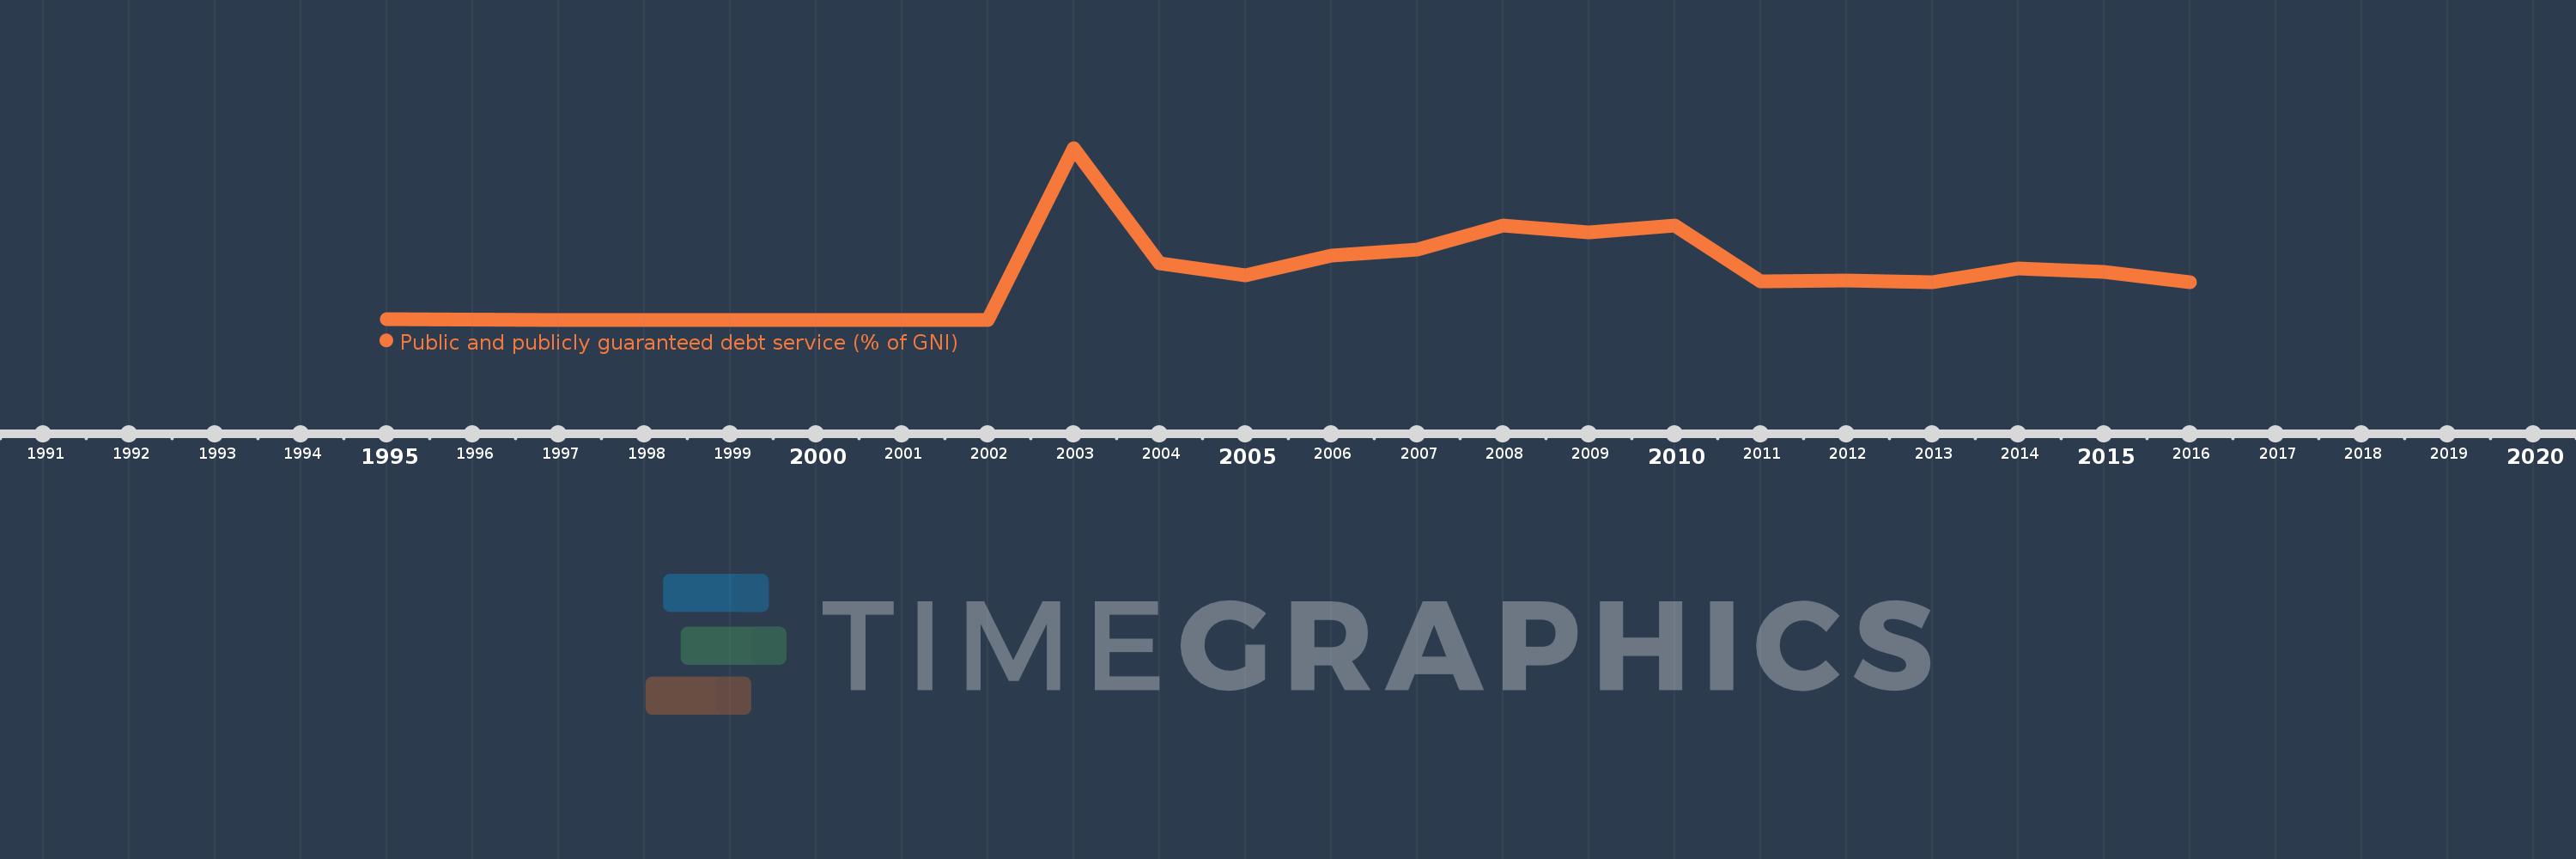
Public and publicly guaranteed debt service (% of GNI)
2016,2015,2014,2013,2012,2011,2010,2009,2008,2007,2006,2005,2004,2003,2002,2001,2000,1997,1995
This statistics in other country:
Timeline:
This timeline shows a graph from 1995 to 2016 of Congo, Dem. Rep.. No data until 1994. Number of actual observations by date: 19.
Source name:
World Development Indicators
Source organization:
World Bank, International Debt Statistics.
Categories, topics:
External Debt
Last updated:
apr 23, 2017
Indicators value changes by year
At the date of observation
Value
Absolute change
Change from previous value
jan 1, 1995
0.017
+0.017
0.0%
jan 1, 1997
0.002
-0.014
-86.85%
jan 1, 2000
0.0
-0.002
-100.0%
jan 1, 2003
4.887
+4.887
%
jan 1, 2004
1.614
-3.273
-66.97%
jan 1, 2005
1.266
-0.348
-21.58%
jan 1, 2006
1.822
+0.557
43.97%
jan 1, 2007
1.996
+0.173
9.51%
jan 1, 2008
2.68
+0.684
34.29%
jan 1, 2009
2.49
-0.19
-7.1%
jan 1, 2010
2.674
+0.184
7.39%
jan 1, 2011
1.089
-1.584
-59.26%
jan 1, 2012
1.122
+0.033
3.02%
jan 1, 2013
1.067
-0.055
-4.89%
jan 1, 2014
1.453
+0.385
36.12%
jan 1, 2015
1.366
-0.087
-5.98%
jan 1, 2016
1.076
-0.29
-21.22%
Ranking of countries by current statistics by years


Comments: