29
/
en
AIzaSyAYiBZKx7MnpbEhh9jyipgxe19OcubqV5w
April 1, 2024
106581
China
CHN
true
2
1
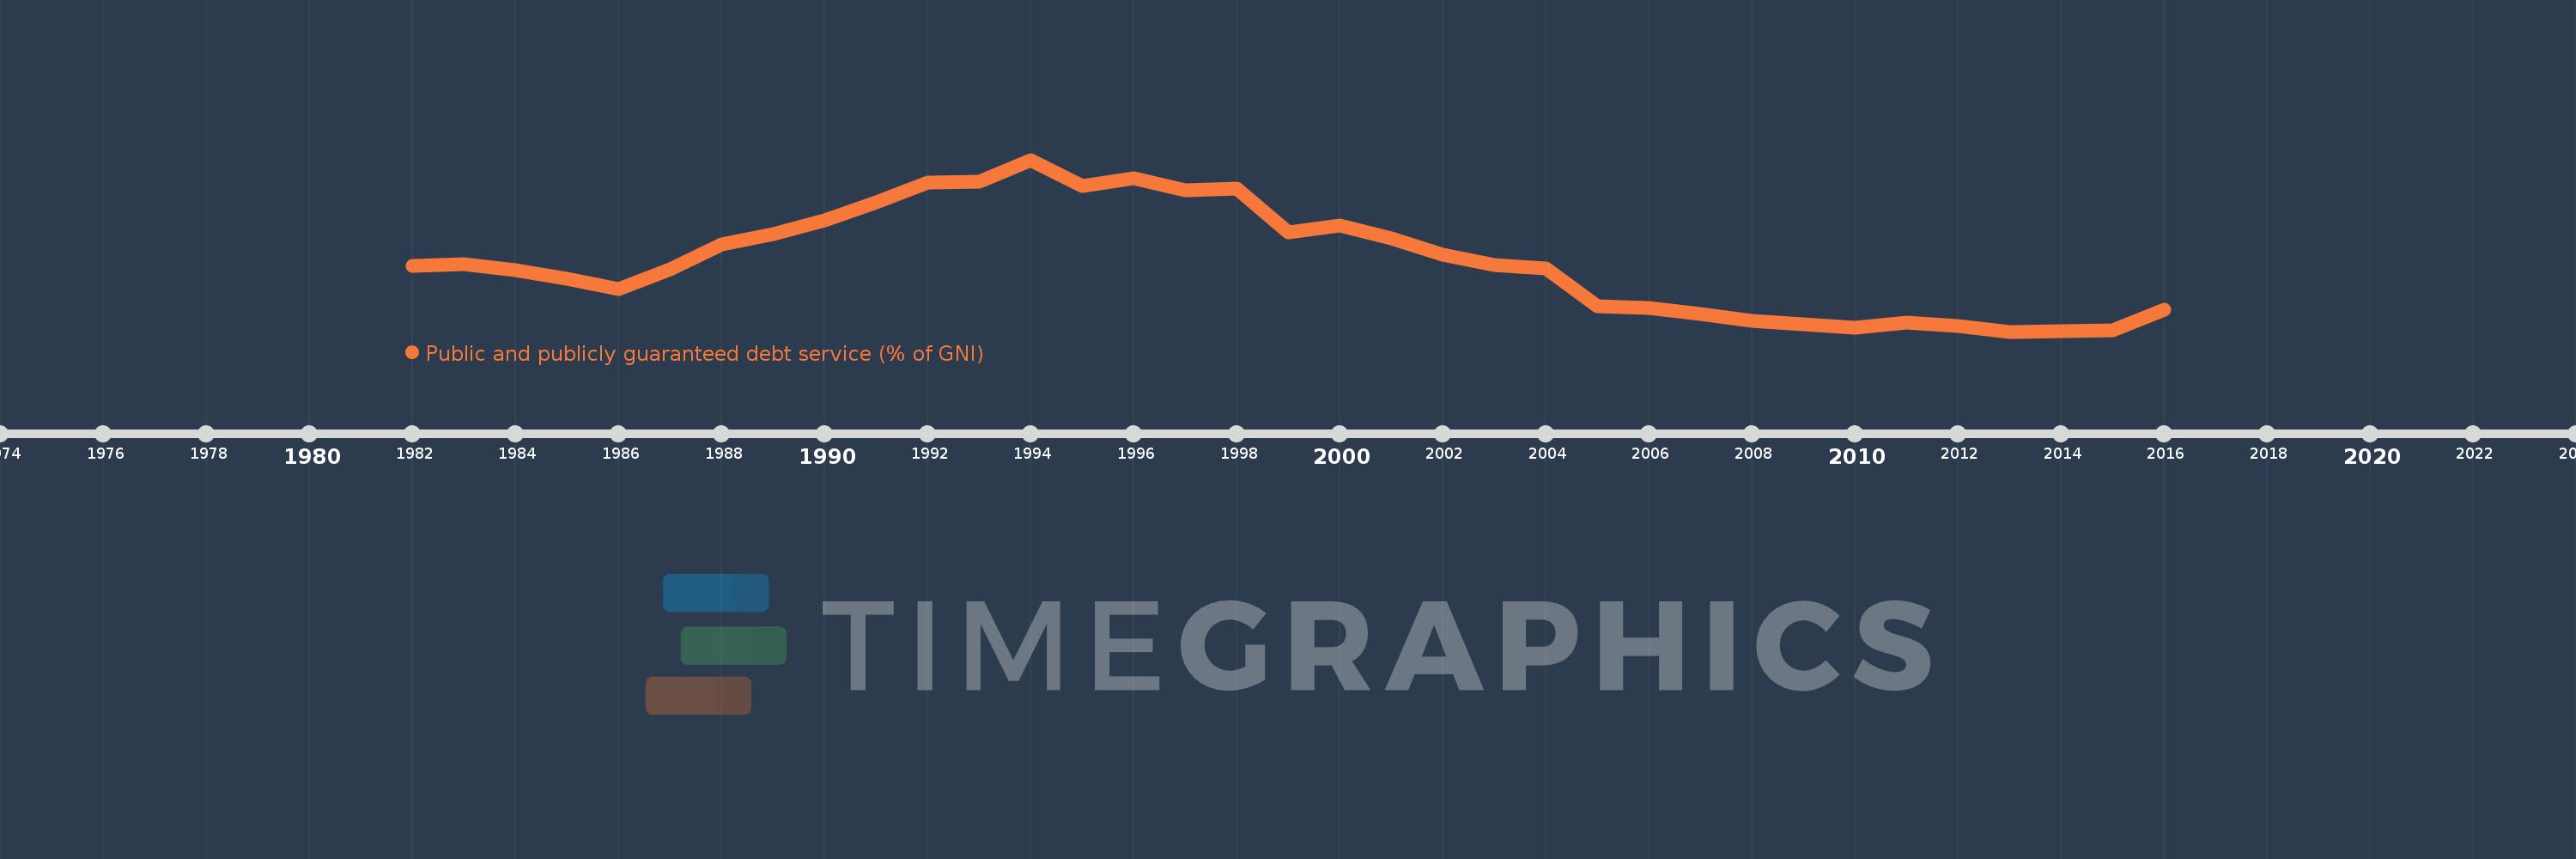
Public and publicly guaranteed debt service (% of GNI)
2016,2015,2014,2013,2012,2011,2010,2009,2008,2007,2006,2005,2004,2003,2002,2001,2000,1999,1998,1997,1996,1995,1994,1993,1992,1991,1990,1989,1988,1987,1986,1985,1984,1983,1982
This statistics in other country:
Timeline:
This timeline shows a graph from 1982 to 2016 of China. No data until 1981. Number of actual observations by date: 35.
Source name:
World Development Indicators
Source organization:
World Bank, International Debt Statistics.
Categories, topics:
External Debt
Last updated:
apr 23, 2017
Indicators value changes by year
At the date of observation
Value
Absolute change
Change from previous value
jan 1, 1982
0.88
+0.88
0.0%
jan 1, 1983
0.898
+0.018
2.02%
jan 1, 1984
0.826
-0.072
-8.0%
jan 1, 1985
0.727
-0.099
-11.98%
jan 1, 1986
0.608
-0.119
-16.35%
jan 1, 1987
0.838
+0.23
37.91%
jan 1, 1988
1.129
+0.291
34.7%
jan 1, 1989
1.248
+0.118
10.49%
jan 1, 1990
1.401
+0.153
12.3%
jan 1, 1991
1.618
+0.216
15.43%
jan 1, 1992
1.842
+0.224
13.88%
jan 1, 1993
1.855
+0.012
0.68%
jan 1, 1994
2.106
+0.251
13.55%
jan 1, 1995
1.804
-0.302
-14.33%
jan 1, 1996
1.895
+0.091
5.02%
jan 1, 1997
1.749
-0.145
-7.67%
jan 1, 1998
1.769
+0.02
1.14%
jan 1, 1999
1.264
-0.505
-28.57%
jan 1, 2000
1.344
+0.08
6.32%
jan 1, 2001
1.201
-0.142
-10.57%
jan 1, 2002
1.006
-0.196
-16.29%
jan 1, 2003
0.894
-0.112
-11.09%
jan 1, 2004
0.847
-0.047
-5.27%
jan 1, 2005
0.408
-0.439
-51.84%
jan 1, 2006
0.39
-0.017
-4.28%
jan 1, 2007
0.321
-0.069
-17.69%
jan 1, 2008
0.241
-0.08
-25.02%
jan 1, 2009
0.202
-0.039
-16.22%
jan 1, 2010
0.168
-0.034
-16.69%
jan 1, 2011
0.225
+0.057
33.97%
jan 1, 2012
0.186
-0.039
-17.23%
jan 1, 2013
0.12
-0.066
-35.52%
jan 1, 2014
0.125
+0.005
4.19%
jan 1, 2015
0.136
+0.011
8.78%
jan 1, 2016
0.377
+0.241
176.52%
Ranking of countries by current statistics by years


Comments: