29
/
en
AIzaSyAYiBZKx7MnpbEhh9jyipgxe19OcubqV5w
April 1, 2024
66636
Algeria
DZA
true
2
1
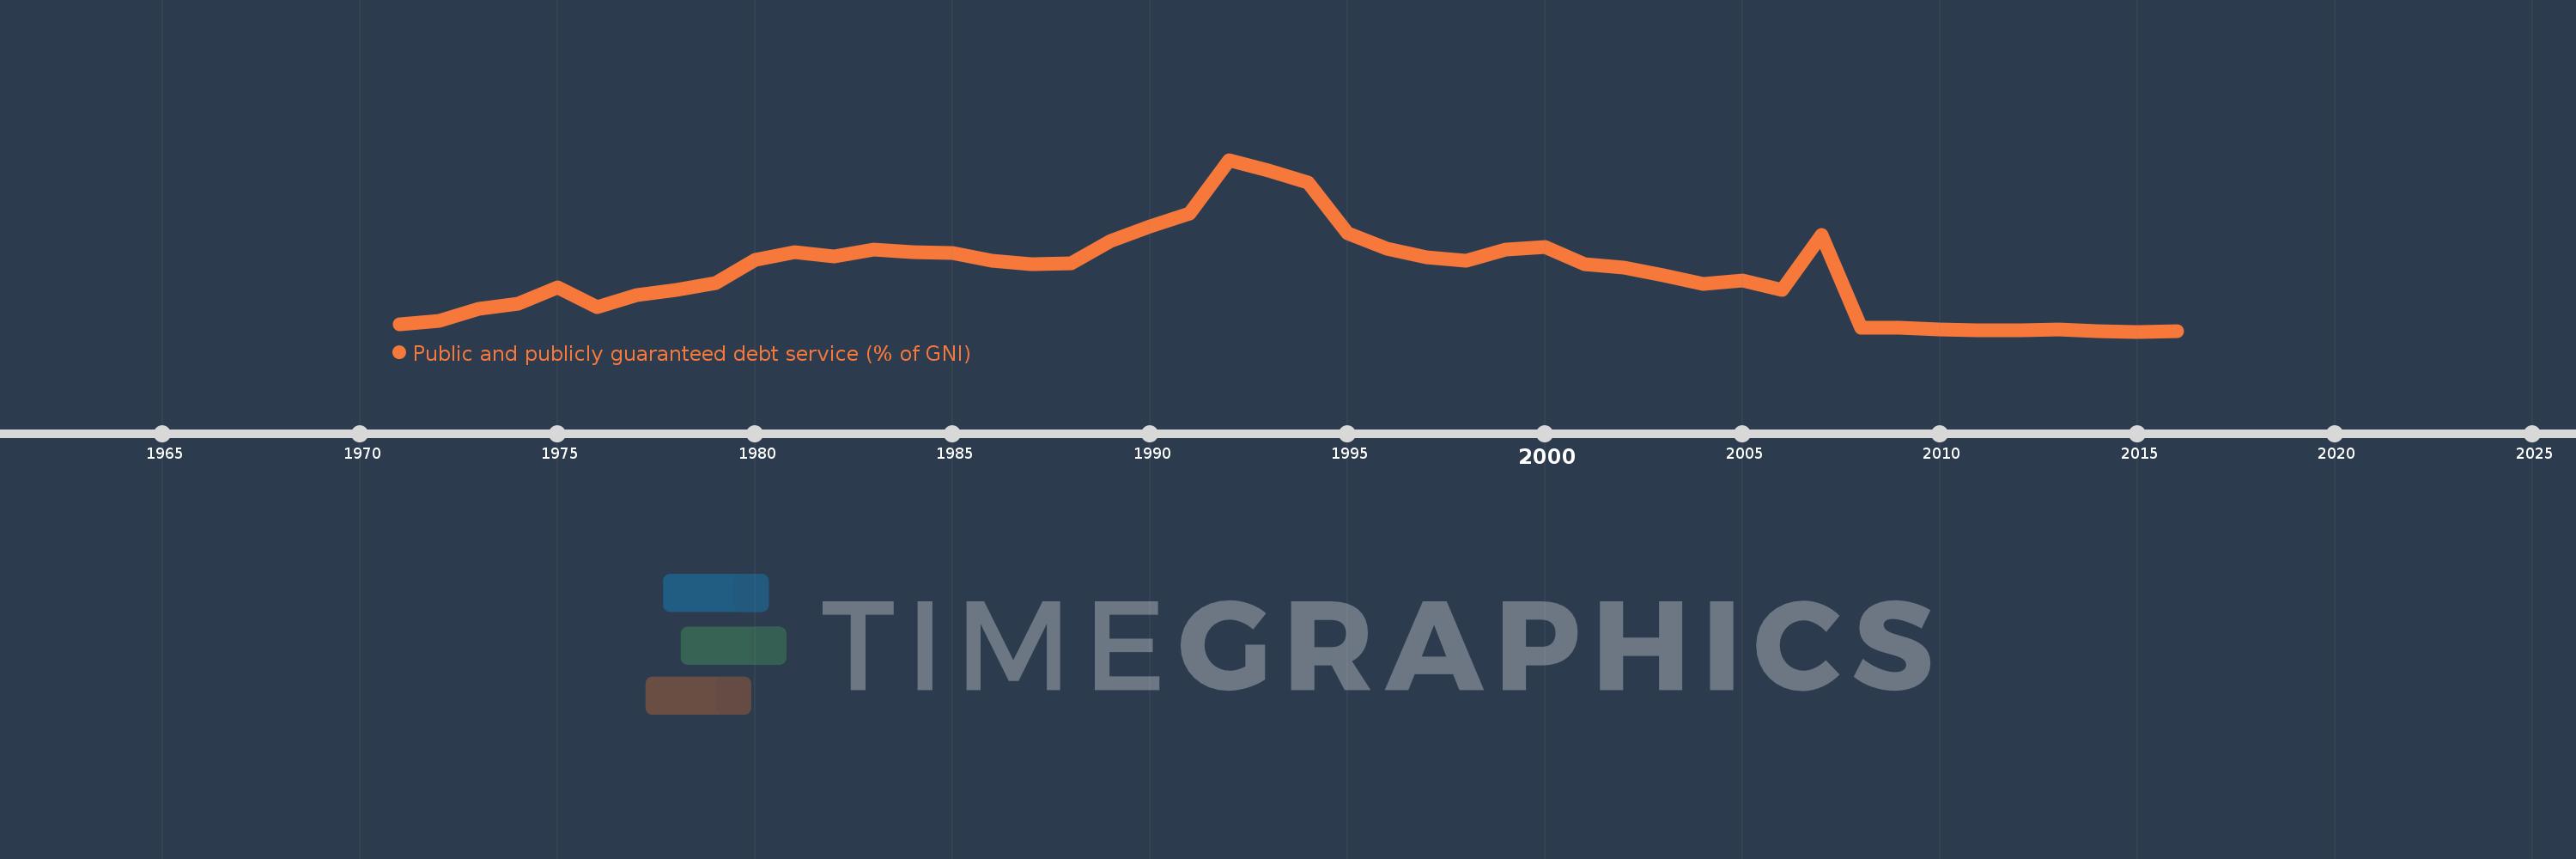
Public and publicly guaranteed debt service (% of GNI)
2016,2015,2014,2013,2012,2011,2010,2009,2008,2007,2006,2005,2004,2003,2002,2001,2000,1999,1998,1997,1996,1995,1994,1993,1992,1991,1990,1989,1988,1987,1986,1985,1984,1983,1982,1981,1980,1979,1978,1977,1976,1975,1974,1973,1972,1971
This statistics in other country:
Timeline:
This timeline shows a graph from 1971 to 2016 of Algeria. No data until 1970. Number of actual observations by date: 46.
Source name:
World Development Indicators
Source organization:
World Bank, International Debt Statistics.
Categories, topics:
External Debt
Last updated:
apr 23, 2017
Indicators value changes by year
Maximum:
20.722
jan 1, 1992
At the date of observation
Value
Absolute change
Change from previous value
jan 1, 1971
0.943
+0.943
0.0%
jan 1, 1972
1.372
+0.43
45.56%
jan 1, 1973
2.82
+1.447
105.46%
jan 1, 1974
3.491
+0.671
23.8%
jan 1, 1975
5.414
+1.924
55.11%
jan 1, 1976
3.05
-2.365
-43.67%
jan 1, 1977
4.521
+1.471
48.24%
jan 1, 1978
5.156
+0.635
14.05%
jan 1, 1979
5.885
+0.729
14.14%
jan 1, 1980
8.758
+2.873
48.82%
jan 1, 1981
9.644
+0.885
10.11%
jan 1, 1982
9.079
-0.564
-5.85%
jan 1, 1983
9.977
+0.898
9.89%
jan 1, 1984
9.642
-0.336
-3.36%
jan 1, 1985
9.529
-0.113
-1.17%
jan 1, 1986
8.647
-0.881
-9.25%
jan 1, 1987
8.239
-0.409
-4.73%
jan 1, 1988
8.266
+0.027
0.33%
jan 1, 1989
11.0
+2.734
33.07%
jan 1, 1990
12.763
+1.763
16.03%
jan 1, 1991
14.29
+1.527
11.96%
jan 1, 1992
20.722
+6.432
45.01%
jan 1, 1993
19.408
-1.314
-6.34%
jan 1, 1994
18.029
-1.379
-7.11%
jan 1, 1995
11.902
-6.127
-33.98%
jan 1, 1996
10.079
-1.823
-15.31%
jan 1, 1997
8.989
-1.09
-10.82%
jan 1, 1998
8.621
-0.368
-4.09%
jan 1, 1999
9.922
+1.301
15.09%
jan 1, 2000
10.245
+0.323
3.25%
jan 1, 2001
8.205
-2.04
-19.91%
jan 1, 2002
7.816
-0.389
-4.74%
jan 1, 2003
6.887
-0.929
-11.88%
jan 1, 2004
5.845
-1.042
-15.13%
jan 1, 2005
6.233
+0.388
6.64%
jan 1, 2006
5.154
-1.079
-17.31%
jan 1, 2007
11.72
+6.565
127.37%
jan 1, 2008
0.564
-11.155
-95.19%
jan 1, 2009
0.606
+0.042
7.37%
jan 1, 2010
0.34
-0.265
-43.81%
jan 1, 2011
0.241
-0.099
-29.12%
jan 1, 2012
0.238
-0.003
-1.12%
jan 1, 2013
0.326
+0.087
36.68%
jan 1, 2014
0.146
-0.18
-55.09%
jan 1, 2015
0.112
-0.034
-23.55%
jan 1, 2016
0.116
+0.004
3.47%
Ranking of countries by current statistics by years


Comments: