29
/
en
AIzaSyAYiBZKx7MnpbEhh9jyipgxe19OcubqV5w
April 1, 2024
81178
Belarus
BLR
true
2
1
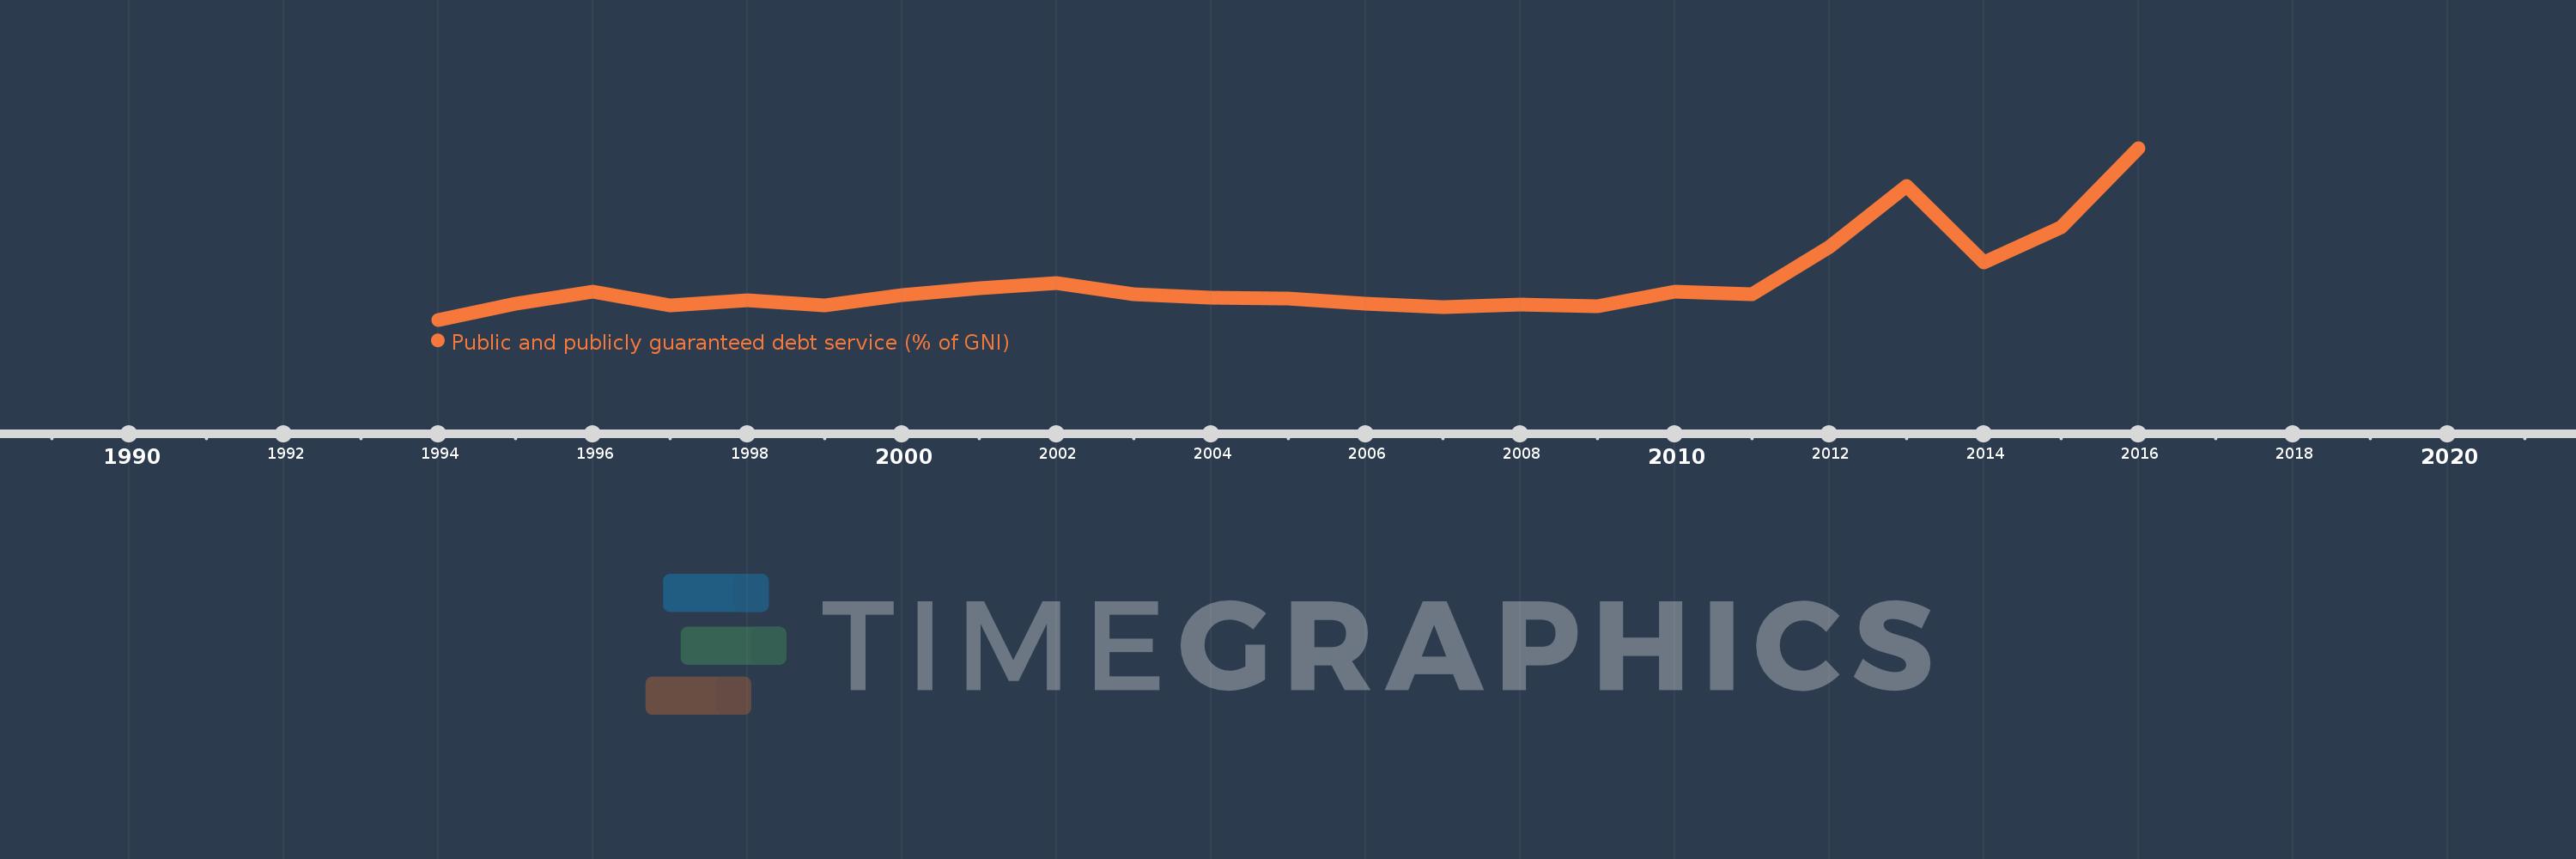
Public and publicly guaranteed debt service (% of GNI)
2016,2015,2014,2013,2012,2011,2010,2009,2008,2007,2006,2005,2004,2003,2002,2001,2000,1999,1998,1997,1996,1995,1994
This statistics in other country:
Timeline:
This timeline shows a graph from 1994 to 2016 of Belarus. No data until 1993. Number of actual observations by date: 23.
Source name:
World Development Indicators
Source organization:
World Bank, International Debt Statistics.
Categories, topics:
External Debt
Last updated:
apr 23, 2017
Indicators value changes by year
At the date of observation
Value
Absolute change
Change from previous value
jan 1, 1994
0.077
+0.077
0.0%
jan 1, 1995
0.735
+0.658
851.97%
jan 1, 1996
1.198
+0.463
62.97%
jan 1, 1997
0.654
-0.543
-45.37%
jan 1, 1998
0.867
+0.213
32.55%
jan 1, 1999
0.667
-0.2
-23.11%
jan 1, 2000
1.081
+0.414
62.03%
jan 1, 2001
1.355
+0.275
25.41%
jan 1, 2002
1.538
+0.183
13.52%
jan 1, 2003
1.098
-0.441
-28.64%
jan 1, 2004
0.951
-0.147
-13.39%
jan 1, 2005
0.93
-0.02
-2.15%
jan 1, 2006
0.714
-0.216
-23.26%
jan 1, 2007
0.587
-0.127
-17.82%
jan 1, 2008
0.673
+0.087
14.78%
jan 1, 2009
0.609
-0.064
-9.57%
jan 1, 2010
1.191
+0.583
95.69%
jan 1, 2011
1.093
-0.099
-8.29%
jan 1, 2012
3.012
+1.92
175.67%
jan 1, 2013
5.447
+2.435
80.84%
jan 1, 2014
2.367
-3.081
-56.56%
jan 1, 2015
3.781
+1.414
59.76%
jan 1, 2016
6.972
+3.191
84.41%
Ranking of countries by current statistics by years


Comments: