29
/
en
AIzaSyAYiBZKx7MnpbEhh9jyipgxe19OcubqV5w
April 1, 2024
265218
Togo
TGO
true
2
1
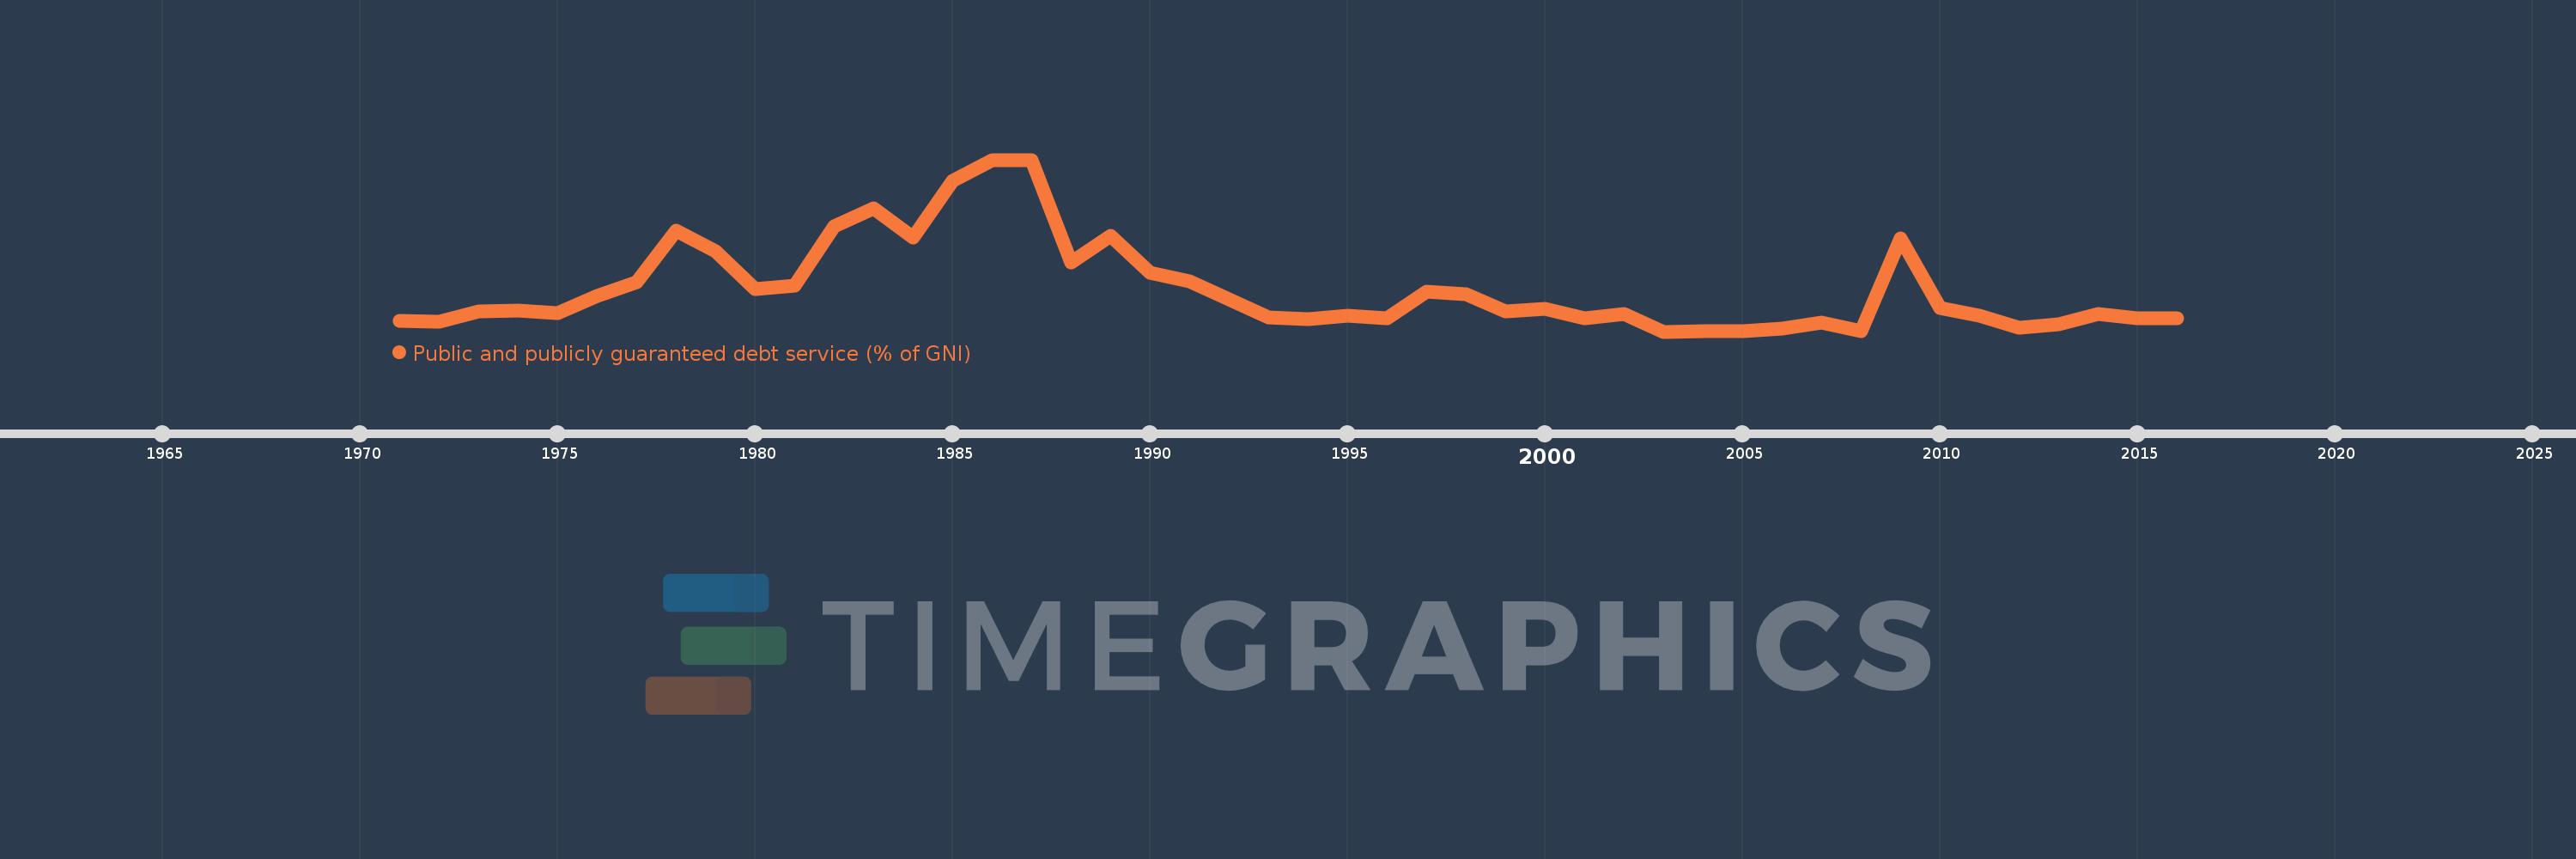
Public and publicly guaranteed debt service (% of GNI)
2016,2015,2014,2013,2012,2011,2010,2009,2008,2007,2006,2005,2004,2003,2002,2001,2000,1999,1998,1997,1996,1995,1994,1993,1992,1991,1990,1989,1988,1987,1986,1985,1984,1983,1982,1981,1980,1979,1978,1977,1976,1975,1974,1973,1972,1971
This statistics in other country:
Timeline:
This timeline shows a graph from 1971 to 2016 of Togo. No data until 1970. Number of actual observations by date: 46.
Source name:
World Development Indicators
Source organization:
World Bank, International Debt Statistics.
Categories, topics:
External Debt
Last updated:
apr 23, 2017
Indicators value changes by year
Maximum:
12.466
jan 1, 1987
At the date of observation
Value
Absolute change
Change from previous value
jan 1, 1971
0.948
+0.948
0.0%
jan 1, 1972
0.858
-0.09
-9.49%
jan 1, 1973
1.61
+0.752
87.71%
jan 1, 1974
1.68
+0.07
4.34%
jan 1, 1975
1.524
-0.156
-9.29%
jan 1, 1976
2.709
+1.185
77.77%
jan 1, 1977
3.737
+1.028
37.96%
jan 1, 1978
7.422
+3.684
98.59%
jan 1, 1979
5.932
-1.49
-20.07%
jan 1, 1980
3.241
-2.691
-45.36%
jan 1, 1981
3.452
+0.211
6.52%
jan 1, 1982
7.703
+4.25
123.11%
jan 1, 1983
8.985
+1.282
16.64%
jan 1, 1984
6.89
-2.095
-23.32%
jan 1, 1985
10.981
+4.092
59.39%
jan 1, 1986
12.411
+1.43
13.02%
jan 1, 1987
12.466
+0.055
0.44%
jan 1, 1988
5.095
-7.371
-59.13%
jan 1, 1989
7.029
+1.934
37.95%
jan 1, 1990
4.363
-2.666
-37.92%
jan 1, 1991
3.757
-0.606
-13.88%
jan 1, 1992
2.45
-1.307
-34.8%
jan 1, 1993
1.16
-1.289
-52.63%
jan 1, 1994
1.074
-0.087
-7.46%
jan 1, 1995
1.3
+0.226
21.02%
jan 1, 1996
1.111
-0.189
-14.55%
jan 1, 1997
3.032
+1.921
172.98%
jan 1, 1998
2.827
-0.205
-6.76%
jan 1, 1999
1.648
-1.178
-41.69%
jan 1, 2000
1.798
+0.149
9.06%
jan 1, 2001
1.152
-0.645
-35.9%
jan 1, 2002
1.431
+0.278
24.17%
jan 1, 2003
0.173
-1.258
-87.91%
jan 1, 2004
0.192
+0.019
11.24%
jan 1, 2005
0.228
+0.036
18.61%
jan 1, 2006
0.399
+0.17
74.69%
jan 1, 2007
0.795
+0.397
99.53%
jan 1, 2008
0.213
-0.583
-73.24%
jan 1, 2009
6.848
+6.635
3.12K%
jan 1, 2010
1.875
-4.974
-72.63%
jan 1, 2011
1.292
-0.582
-31.06%
jan 1, 2012
0.455
-0.838
-64.81%
jan 1, 2013
0.678
+0.223
49.14%
jan 1, 2014
1.43
+0.752
110.87%
jan 1, 2015
1.111
-0.319
-22.3%
jan 1, 2016
1.124
+0.013
1.16%
Ranking of countries by current statistics by years


Comments: