29
/
en
AIzaSyAYiBZKx7MnpbEhh9jyipgxe19OcubqV5w
April 1, 2024
70449
Argentina
ARG
true
2
1
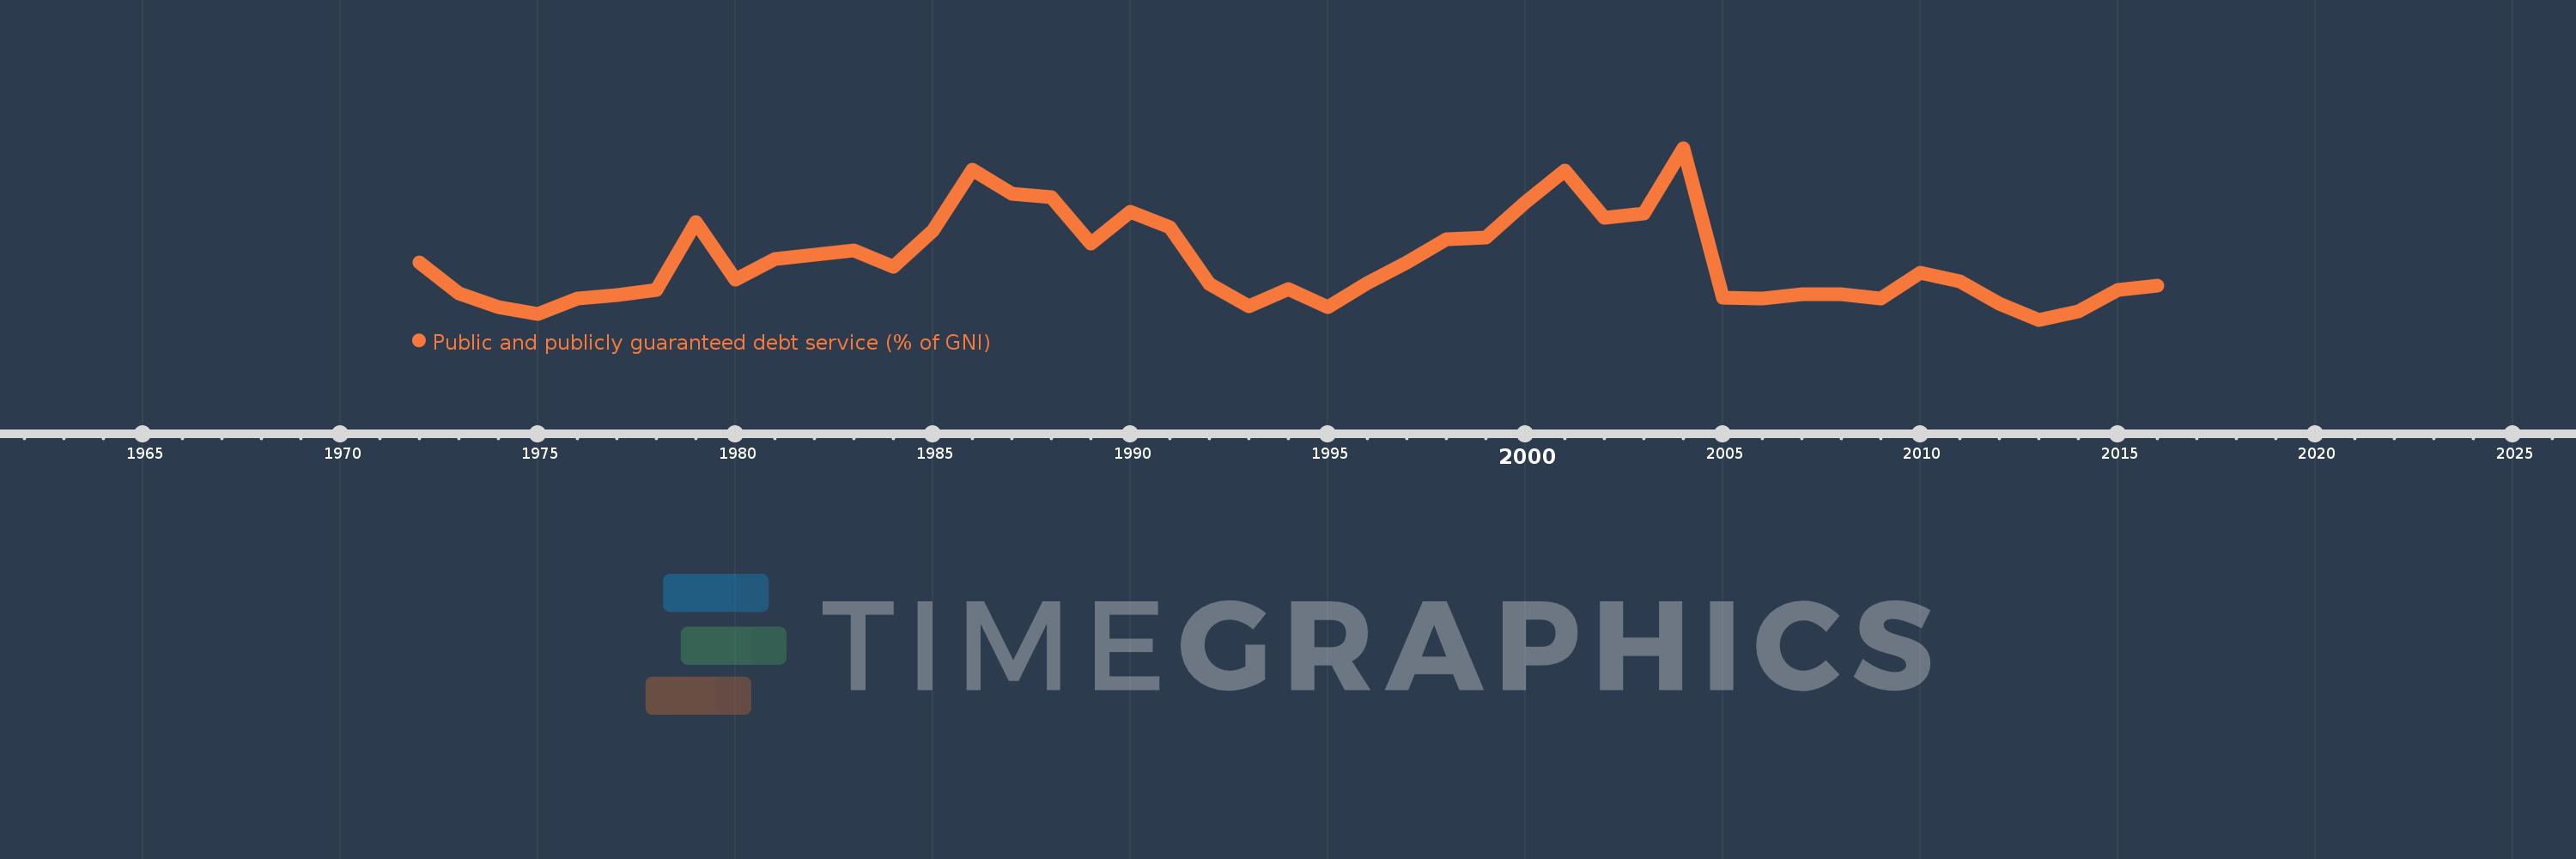
Public and publicly guaranteed debt service (% of GNI)
2016,2015,2014,2013,2012,2011,2010,2009,2008,2007,2006,2005,2004,2003,2002,2001,2000,1999,1998,1997,1996,1995,1994,1993,1992,1991,1990,1989,1988,1987,1986,1985,1984,1983,1982,1981,1980,1979,1978,1977,1976,1975,1974,1973,1972
This statistics in other country:
Timeline:
This timeline shows a graph from 1972 to 2016 of Argentina. No data until 1971. Number of actual observations by date: 45.
Source name:
World Development Indicators
Source organization:
World Bank, International Debt Statistics.
Categories, topics:
External Debt
Last updated:
apr 23, 2017
Indicators value changes by year
At the date of observation
Value
Absolute change
Change from previous value
jan 1, 1972
2.633
+2.633
0.0%
jan 1, 1973
1.781
-0.852
-32.34%
jan 1, 1974
1.43
-0.352
-19.75%
jan 1, 1975
1.24
-0.19
-13.3%
jan 1, 1976
1.641
+0.401
32.35%
jan 1, 1977
1.738
+0.098
5.94%
jan 1, 1978
1.886
+0.148
8.5%
jan 1, 1979
3.705
+1.819
96.46%
jan 1, 1980
2.171
-1.534
-41.4%
jan 1, 1981
2.708
+0.537
24.74%
jan 1, 1982
2.829
+0.121
4.46%
jan 1, 1983
2.954
+0.125
4.44%
jan 1, 1984
2.515
-0.439
-14.86%
jan 1, 1985
3.468
+0.953
37.89%
jan 1, 1986
5.125
+1.656
47.75%
jan 1, 1987
4.462
-0.662
-12.93%
jan 1, 1988
4.385
-0.077
-1.74%
jan 1, 1989
3.13
-1.255
-28.61%
jan 1, 1990
3.977
+0.847
27.07%
jan 1, 1991
3.578
-0.4
-10.05%
jan 1, 1992
2.054
-1.524
-42.59%
jan 1, 1993
1.439
-0.615
-29.95%
jan 1, 1994
1.903
+0.464
32.28%
jan 1, 1995
1.424
-0.479
-25.17%
jan 1, 1996
2.073
+0.649
45.58%
jan 1, 1997
2.623
+0.55
26.53%
jan 1, 1998
3.257
+0.633
24.15%
jan 1, 1999
3.296
+0.039
1.2%
jan 1, 2000
4.253
+0.957
29.04%
jan 1, 2001
5.09
+0.837
19.68%
jan 1, 2002
3.83
-1.26
-24.76%
jan 1, 2003
3.945
+0.116
3.02%
jan 1, 2004
5.706
+1.761
44.63%
jan 1, 2005
1.664
-4.042
-70.84%
jan 1, 2006
1.656
-0.009
-0.52%
jan 1, 2007
1.762
+0.107
6.44%
jan 1, 2008
1.772
+0.01
0.58%
jan 1, 2009
1.652
-0.12
-6.77%
jan 1, 2010
2.343
+0.69
41.78%
jan 1, 2011
2.12
-0.223
-9.51%
jan 1, 2012
1.506
-0.614
-28.97%
jan 1, 2013
1.081
-0.425
-28.2%
jan 1, 2014
1.313
+0.232
21.43%
jan 1, 2015
1.887
+0.574
43.75%
jan 1, 2016
2.004
+0.117
6.18%
Ranking of countries by current statistics by years


Comments: