29
/
en
AIzaSyAYiBZKx7MnpbEhh9jyipgxe19OcubqV5w
April 1, 2024
157889
Iran, Islamic Rep.
IRN
true
2
1
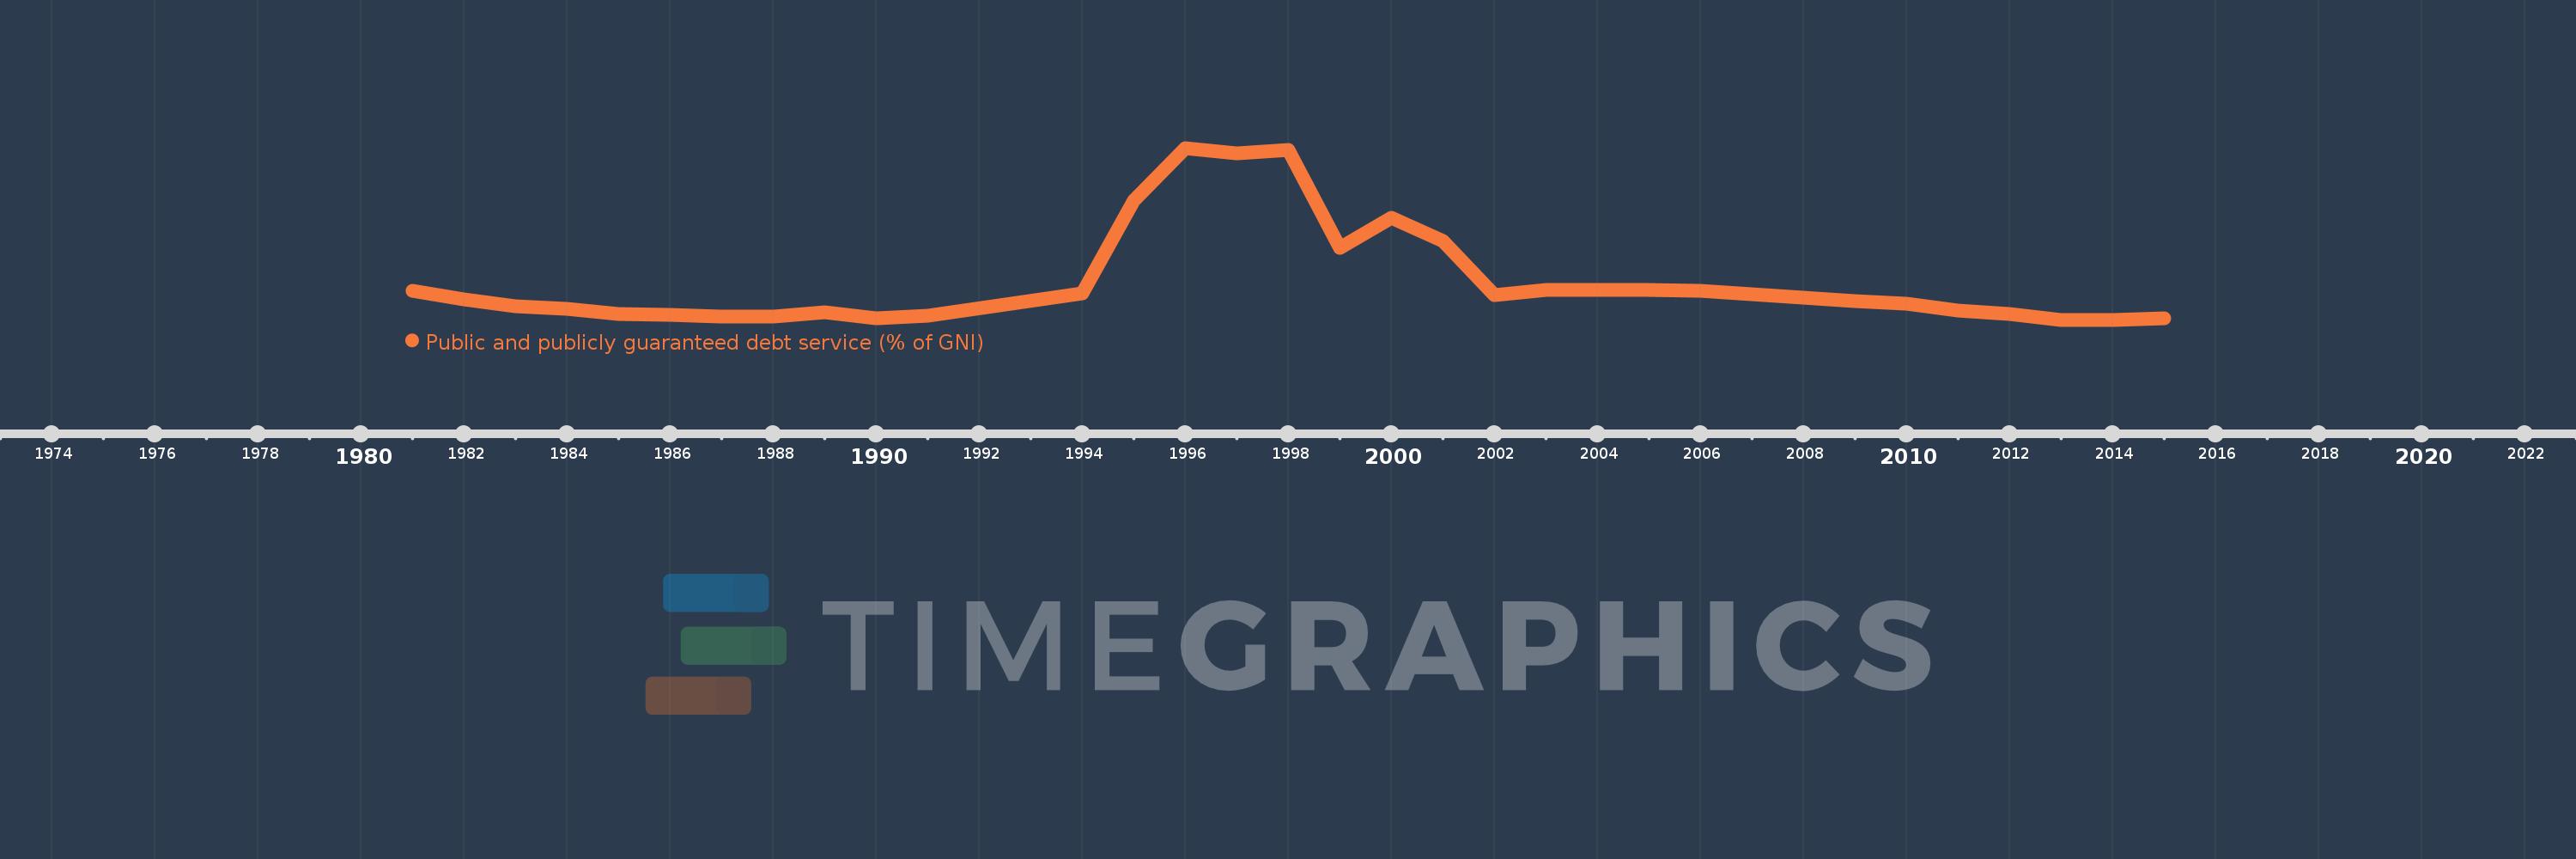
Public and publicly guaranteed debt service (% of GNI)
2015,2014,2013,2012,2011,2010,2009,2008,2007,2006,2005,2004,2003,2002,2001,2000,1999,1998,1997,1996,1995,1994,1991,1990,1989,1988,1987,1986,1985,1984,1983,1982,1981
This statistics in other country:
Timeline:
This timeline shows a graph from 1981 to 2015 of Iran, Islamic Rep.. No data until 1980. Number of actual observations by date: 33.
Source name:
World Development Indicators
Source organization:
World Bank, International Debt Statistics.
Categories, topics:
External Debt
Last updated:
apr 23, 2017
Indicators value changes by year
At the date of observation
Value
Absolute change
Change from previous value
jan 1, 1981
0.982
+0.982
0.0%
jan 1, 1982
0.702
-0.279
-28.44%
jan 1, 1983
0.503
-0.199
-28.38%
jan 1, 1984
0.414
-0.089
-17.74%
jan 1, 1985
0.272
-0.142
-34.28%
jan 1, 1986
0.224
-0.048
-17.69%
jan 1, 1987
0.178
-0.046
-20.38%
jan 1, 1988
0.183
+0.005
2.77%
jan 1, 1989
0.316
+0.133
72.39%
jan 1, 1990
0.136
-0.179
-56.83%
jan 1, 1991
0.202
+0.066
48.1%
jan 1, 1994
0.892
+0.69
341.97%
jan 1, 1995
3.734
+2.842
318.43%
jan 1, 1996
5.365
+1.631
43.69%
jan 1, 1997
5.197
-0.168
-3.13%
jan 1, 1998
5.312
+0.115
2.21%
jan 1, 1999
2.292
-3.021
-56.86%
jan 1, 2000
3.221
+0.929
40.55%
jan 1, 2001
2.5
-0.721
-22.4%
jan 1, 2002
0.851
-1.649
-65.97%
jan 1, 2003
1.004
+0.154
18.07%
jan 1, 2004
0.995
-0.01
-0.97%
jan 1, 2005
0.987
-0.007
-0.74%
jan 1, 2006
0.981
-0.006
-0.66%
jan 1, 2007
0.86
-0.121
-12.32%
jan 1, 2008
0.761
-0.099
-11.46%
jan 1, 2009
0.66
-0.102
-13.35%
jan 1, 2010
0.582
-0.078
-11.81%
jan 1, 2011
0.366
-0.215
-37.02%
jan 1, 2012
0.253
-0.113
-30.89%
jan 1, 2013
0.082
-0.172
-67.74%
jan 1, 2014
0.084
+0.002
2.41%
jan 1, 2015
0.116
+0.033
38.93%
Ranking of countries by current statistics by years


Comments: