29
/
en
AIzaSyAYiBZKx7MnpbEhh9jyipgxe19OcubqV5w
April 1, 2024
46622
Low income
LIC
false
2
1
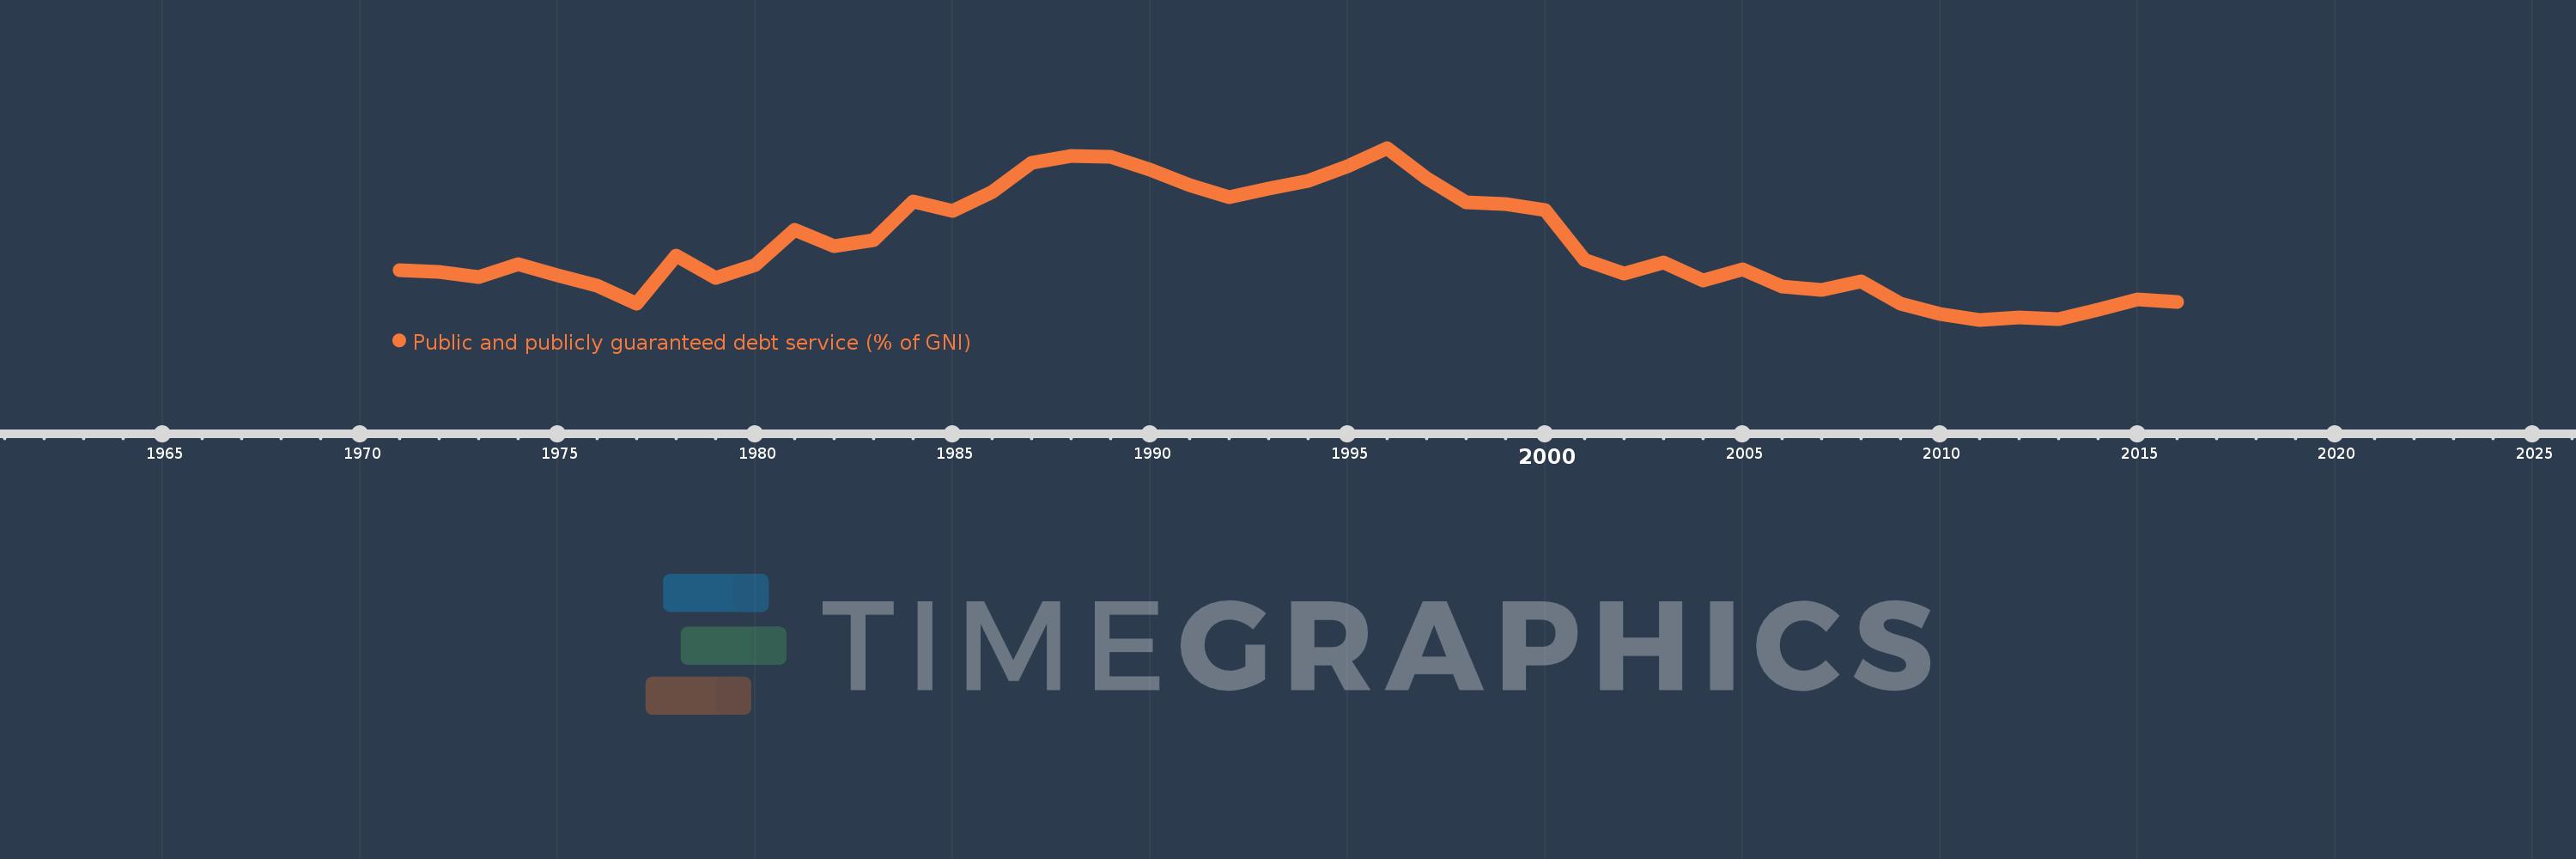
Public and publicly guaranteed debt service (% of GNI)
2016,2015,2014,2013,2012,2011,2010,2009,2008,2007,2006,2005,2004,2003,2002,2001,2000,1999,1998,1997,1996,1995,1994,1993,1992,1991,1990,1989,1988,1987,1986,1985,1984,1983,1982,1981,1980,1979,1978,1977,1976,1975,1974,1973,1972,1971
This statistics in other country:
Timeline:
This timeline shows a graph from 1971 to 2016 of Low income. No data until 1970. Number of actual observations by date: 46.
Source name:
World Development Indicators
Source organization:
World Bank, International Debt Statistics.
Categories, topics:
External Debt
Last updated:
apr 23, 2017
Indicators value changes by year
At the date of observation
Value
Absolute change
Change from previous value
jan 1, 1971
1.399
+1.399
0.0%
jan 1, 1972
1.368
-0.031
-2.25%
jan 1, 1973
1.289
-0.079
-5.76%
jan 1, 1974
1.49
+0.201
15.59%
jan 1, 1975
1.319
-0.171
-11.5%
jan 1, 1976
1.16
-0.159
-12.02%
jan 1, 1977
0.887
-0.274
-23.59%
jan 1, 1978
1.626
+0.739
83.38%
jan 1, 1979
1.284
-0.341
-21.0%
jan 1, 1980
1.477
+0.193
15.05%
jan 1, 1981
2.01
+0.532
36.01%
jan 1, 1982
1.77
-0.239
-11.91%
jan 1, 1983
1.855
+0.085
4.79%
jan 1, 1984
2.45
+0.595
32.09%
jan 1, 1985
2.298
-0.152
-6.22%
jan 1, 1986
2.592
+0.294
12.79%
jan 1, 1987
3.045
+0.453
17.49%
jan 1, 1988
3.149
+0.104
3.41%
jan 1, 1989
3.13
-0.019
-0.59%
jan 1, 1990
2.935
-0.195
-6.22%
jan 1, 1991
2.692
-0.243
-8.3%
jan 1, 1992
2.511
-0.181
-6.71%
jan 1, 1993
2.644
+0.133
5.29%
jan 1, 1994
2.767
+0.123
4.66%
jan 1, 1995
2.982
+0.215
7.78%
jan 1, 1996
3.266
+0.283
9.5%
jan 1, 1997
2.802
-0.464
-14.2%
jan 1, 1998
2.44
-0.362
-12.93%
jan 1, 1999
2.407
-0.033
-1.36%
jan 1, 2000
2.316
-0.09
-3.75%
jan 1, 2001
1.557
-0.759
-32.77%
jan 1, 2002
1.342
-0.215
-13.79%
jan 1, 2003
1.516
+0.173
12.92%
jan 1, 2004
1.234
-0.282
-18.6%
jan 1, 2005
1.414
+0.18
14.56%
jan 1, 2006
1.146
-0.267
-18.92%
jan 1, 2007
1.097
-0.049
-4.25%
jan 1, 2008
1.23
+0.133
12.08%
jan 1, 2009
0.889
-0.341
-27.74%
jan 1, 2010
0.728
-0.161
-18.1%
jan 1, 2011
0.638
-0.09
-12.3%
jan 1, 2012
0.672
+0.034
5.27%
jan 1, 2013
0.643
-0.029
-4.24%
jan 1, 2014
0.788
+0.144
22.41%
jan 1, 2015
0.944
+0.156
19.79%
jan 1, 2016
0.908
-0.035
-3.74%
Ranking of countries by current statistics by years


Comments: