29
/
en
AIzaSyAYiBZKx7MnpbEhh9jyipgxe19OcubqV5w
April 1, 2024
199792
Mongolia
MNG
true
2
1
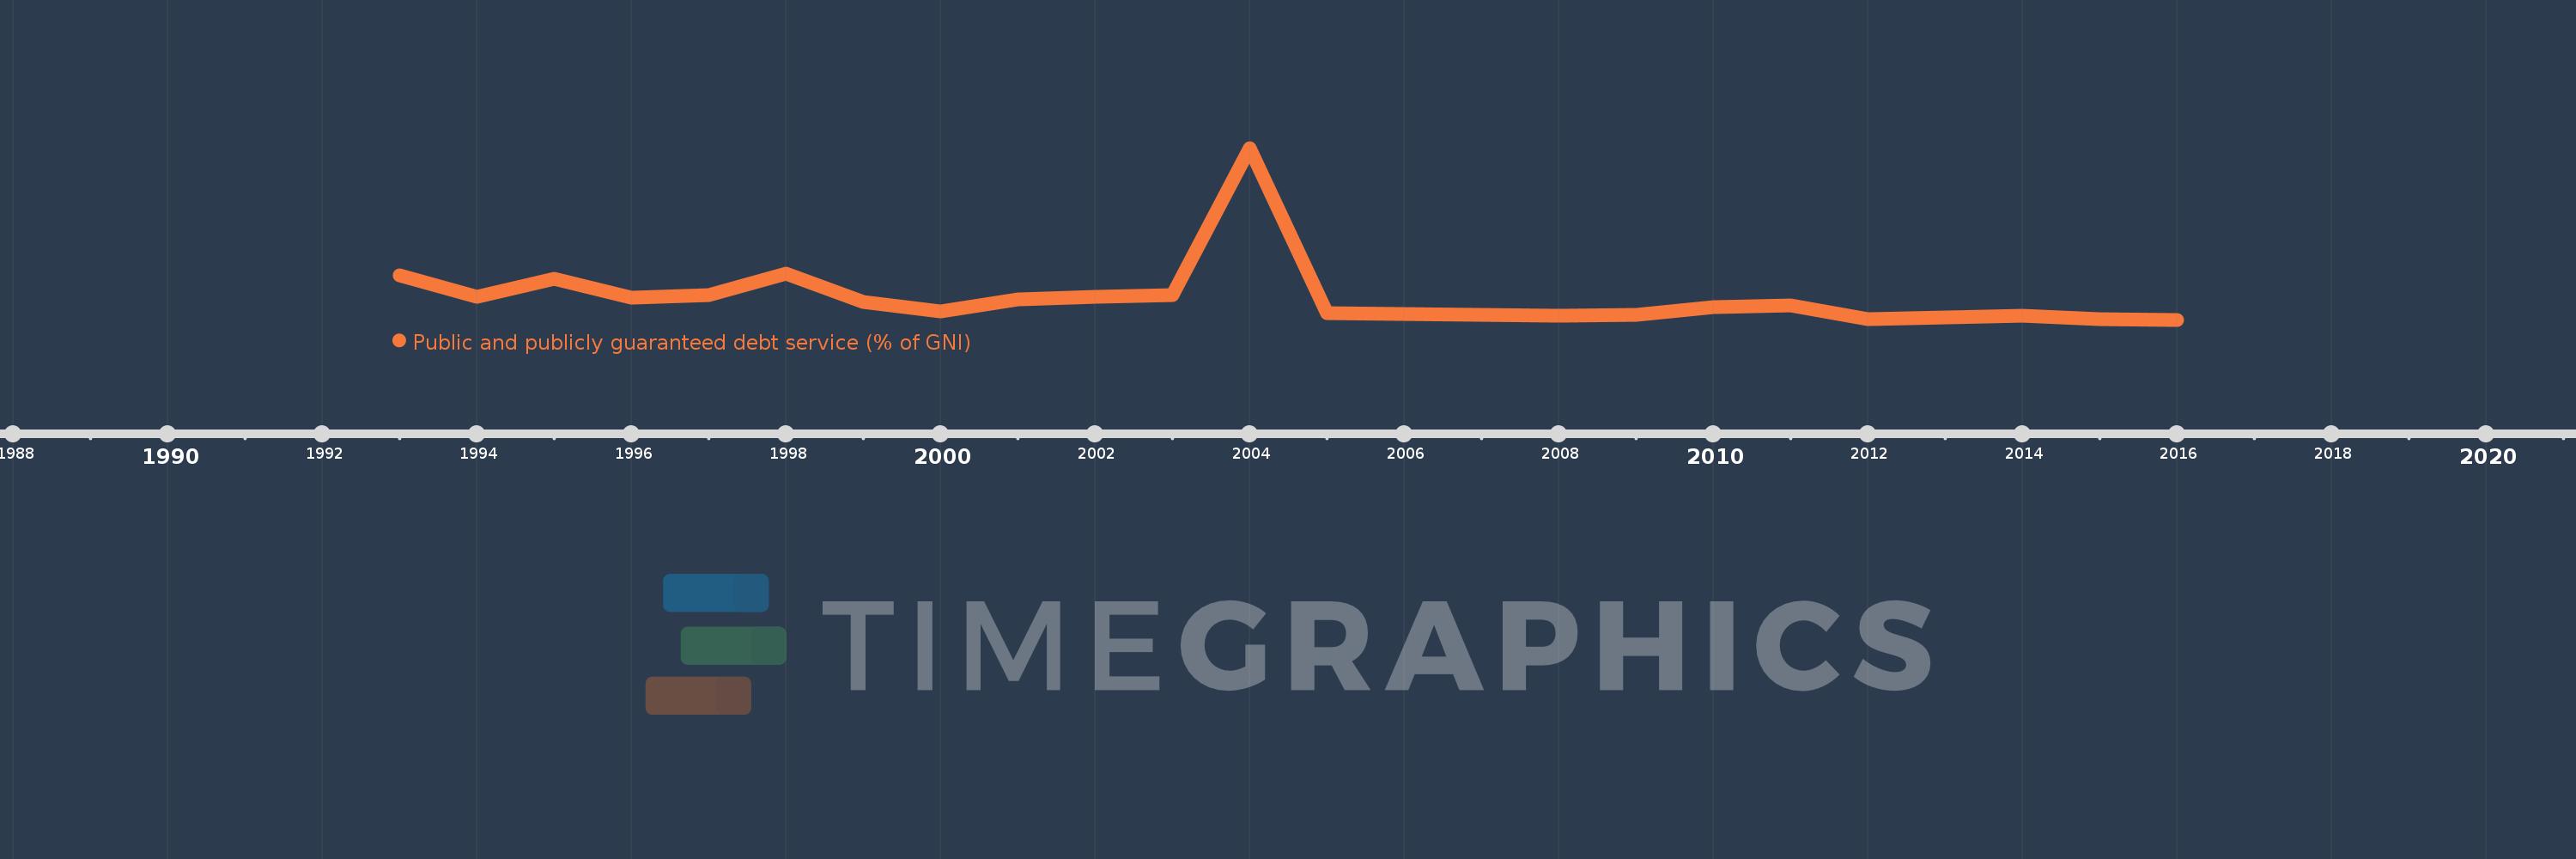
Public and publicly guaranteed debt service (% of GNI)
2016,2015,2014,2013,2012,2011,2010,2009,2008,2007,2006,2005,2004,2003,2002,2001,2000,1999,1998,1997,1996,1995,1994,1993
This statistics in other country:
Timeline:
This timeline shows a graph from 1993 to 2016 of Mongolia. No data until 1992. Number of actual observations by date: 24.
Source name:
World Development Indicators
Source organization:
World Bank, International Debt Statistics.
Categories, topics:
External Debt
Last updated:
apr 23, 2017
Indicators value changes by year
At the date of observation
Value
Absolute change
Change from previous value
jan 1, 1993
5.088
+5.088
0.0%
jan 1, 1994
2.993
-2.095
-41.17%
jan 1, 1995
4.75
+1.757
58.69%
jan 1, 1996
2.879
-1.87
-39.38%
jan 1, 1997
3.163
+0.284
9.85%
jan 1, 1998
5.238
+2.075
65.62%
jan 1, 1999
2.497
-2.741
-52.33%
jan 1, 2000
1.524
-0.973
-38.97%
jan 1, 2001
2.758
+1.234
80.97%
jan 1, 2002
2.99
+0.232
8.43%
jan 1, 2003
3.162
+0.172
5.75%
jan 1, 2004
17.52
+14.358
454.11%
jan 1, 2005
1.358
-16.163
-92.25%
jan 1, 2006
1.292
-0.066
-4.83%
jan 1, 2007
1.197
-0.095
-7.36%
jan 1, 2008
1.099
-0.098
-8.16%
jan 1, 2009
1.179
+0.08
7.27%
jan 1, 2010
1.985
+0.806
68.31%
jan 1, 2011
2.142
+0.157
7.92%
jan 1, 2012
0.783
-1.359
-63.46%
jan 1, 2013
0.929
+0.146
18.7%
jan 1, 2014
1.099
+0.17
18.27%
jan 1, 2015
0.761
-0.338
-30.71%
jan 1, 2016
0.735
-0.027
-3.52%
Ranking of countries by current statistics by years


Comments: