29
/
en
AIzaSyAYiBZKx7MnpbEhh9jyipgxe19OcubqV5w
April 1, 2024
237752
Serbia
SRB
true
2
1
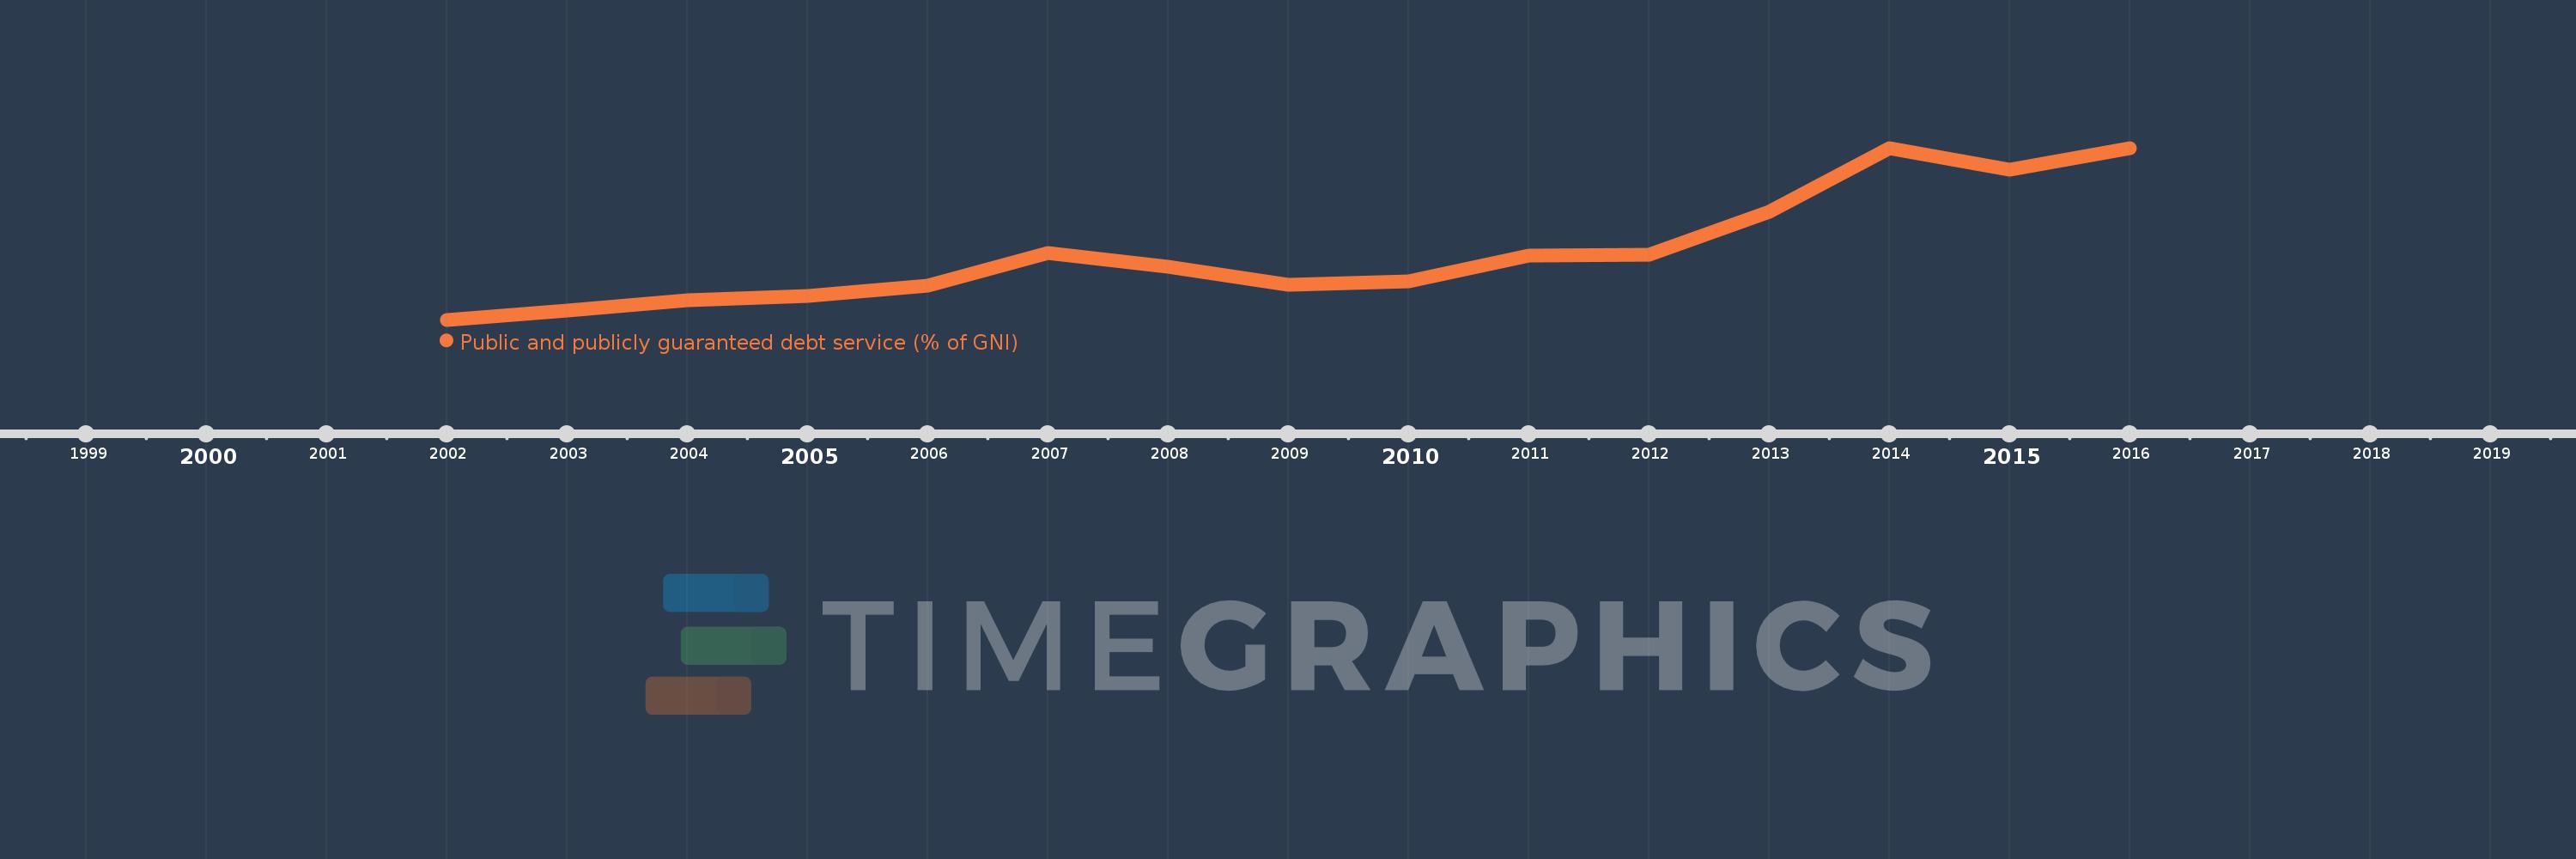
Public and publicly guaranteed debt service (% of GNI)
2016,2015,2014,2013,2012,2011,2010,2009,2008,2007,2006,2005,2004,2003,2002
This statistics in other country:
Timeline:
This timeline shows a graph from 2002 to 2016 of Serbia. No data until 2001. Number of actual observations by date: 15.
Source name:
World Development Indicators
Source organization:
World Bank, International Debt Statistics.
Categories, topics:
External Debt
Last updated:
apr 23, 2017
Indicators value changes by year
At the date of observation
Value
Absolute change
Change from previous value
jan 1, 2002
0.379
+0.379
0.0%
jan 1, 2003
0.582
+0.204
53.81%
jan 1, 2004
0.792
+0.21
36.04%
jan 1, 2005
0.887
+0.095
11.95%
jan 1, 2006
1.101
+0.214
24.08%
jan 1, 2007
1.796
+0.695
63.16%
jan 1, 2008
1.517
-0.279
-15.53%
jan 1, 2009
1.117
-0.4
-26.35%
jan 1, 2010
1.207
+0.09
8.06%
jan 1, 2011
1.741
+0.534
44.23%
jan 1, 2012
1.758
+0.017
0.98%
jan 1, 2013
2.677
+0.918
52.21%
jan 1, 2014
4.046
+1.369
51.15%
jan 1, 2015
3.581
-0.464
-11.47%
jan 1, 2016
4.04
+0.458
12.79%
Ranking of countries by current statistics by years


Comments: